

The structure and relative intensities of the X-ray emission between two deep core
levels are relatively independent of the chemical form of a particular element. For
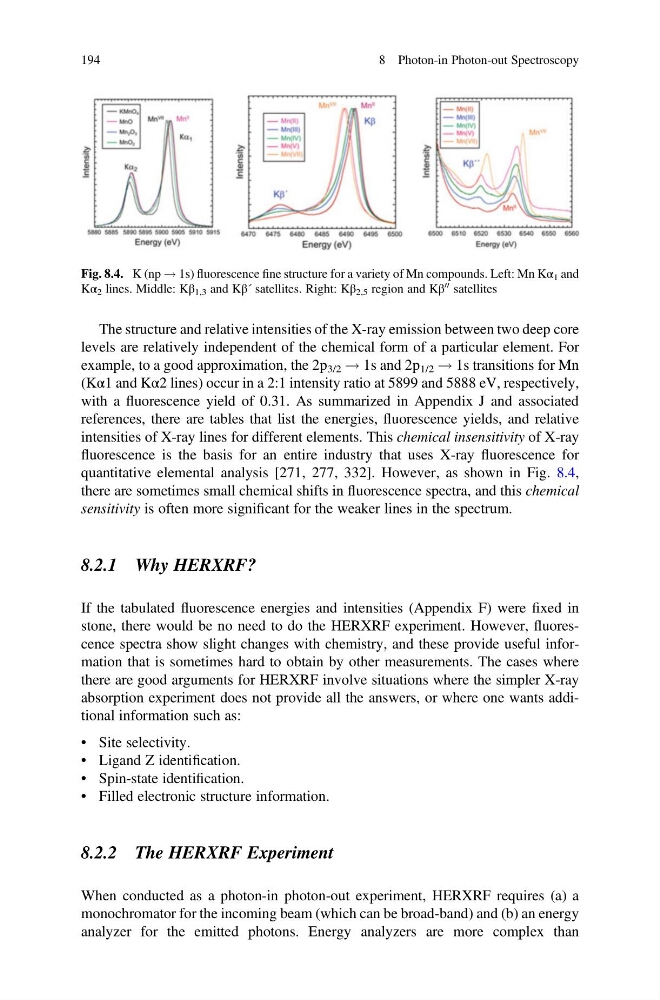
example, to a good approximation, the 2p 3/2 ! 1s and 2p 1/2 ! 1s transitions for Mn
(Kα1 and Kα2 lines) occur in a 2:1 intensity ratio at 5899 and 5888 eV, respectively,
with a fluorescence yield of 0.31. As summarized in Appendix J and associated
references, there are tables that list the energies, fluorescence yields, and relative
intensities of X-ray lines for different elements. This chemical insensitivity of X-ray
fluorescence is the basis for an entire industry that uses X-ray fluorescence for
quantitative elemental analysis [271, 277, 332]. However, as shown in Fig. 8.4,
there are sometimes small chemical shifts in fluorescence spectra, and this chemical
sensitivity is often more significant for the weaker lines in the spectrum.
8.2.1 Why HERXRF?
If the tabulated fluorescence energies and intensities (Appendix F) were fixed in
stone, there would be no need to do the HERXRF experiment. However, fluorescence spectra show slight changes with chemistry, and these provide useful information that is sometimes hard to obtain by other measurements. The cases where
there are good arguments for HERXRF involve situations where the simpler X-ray
absorption experiment does not provide all the answers, or where one wants additional information such as:
• Site selectivity.
• Ligand Z identification.
• Spin-state identification.
• Filled electronic structure information.
8.2.2 The HERXRF Experiment
When conducted as a photon-in photon-out experiment, HERXRF requires (a) a
monochromator for the incoming beam (which can be broad-band) and (b) an energy
analyzer for the emitted photons. Energy analyzers are more complex than
Fig. 8.4. K (np ! 1s) fluorescence fine structure for a variety of Mn compounds. Left: Mn Kα 1 and
Kα 2 lines. Middle: Kβ 1,3 and Kβ´ satellites. Right: Kβ 2,5 region and Kβ
00 satellites
194
8 Photon-in Photon-out Spectroscopy
levels are relatively independent of the chemical form of a particular element. For
example, to a good approximation, the 2p 3/2 ! 1s and 2p 1/2 ! 1s transitions for Mn
(Kα1 and Kα2 lines) occur in a 2:1 intensity ratio at 5899 and 5888 eV, respectively,
with a fluorescence yield of 0.31. As summarized in Appendix J and associated
references, there are tables that list the energies, fluorescence yields, and relative
intensities of X-ray lines for different elements. This chemical insensitivity of X-ray
fluorescence is the basis for an entire industry that uses X-ray fluorescence for
quantitative elemental analysis [271, 277, 332]. However, as shown in Fig. 8.4,
there are sometimes small chemical shifts in fluorescence spectra, and this chemical
sensitivity is often more significant for the weaker lines in the spectrum.
8.2.1 Why HERXRF?
If the tabulated fluorescence energies and intensities (Appendix F) were fixed in
stone, there would be no need to do the HERXRF experiment. However, fluorescence spectra show slight changes with chemistry, and these provide useful information that is sometimes hard to obtain by other measurements. The cases where
there are good arguments for HERXRF involve situations where the simpler X-ray
absorption experiment does not provide all the answers, or where one wants additional information such as:
• Site selectivity.
• Ligand Z identification.
• Spin-state identification.
• Filled electronic structure information.
8.2.2 The HERXRF Experiment
When conducted as a photon-in photon-out experiment, HERXRF requires (a) a
monochromator for the incoming beam (which can be broad-band) and (b) an energy
analyzer for the emitted photons. Energy analyzers are more complex than
Fig. 8.4. K (np ! 1s) fluorescence fine structure for a variety of Mn compounds. Left: Mn Kα 1 and
Kα 2 lines. Middle: Kβ 1,3 and Kβ´ satellites. Right: Kβ 2,5 region and Kβ
00 satellites
194
8 Photon-in Photon-out Spectroscopy