

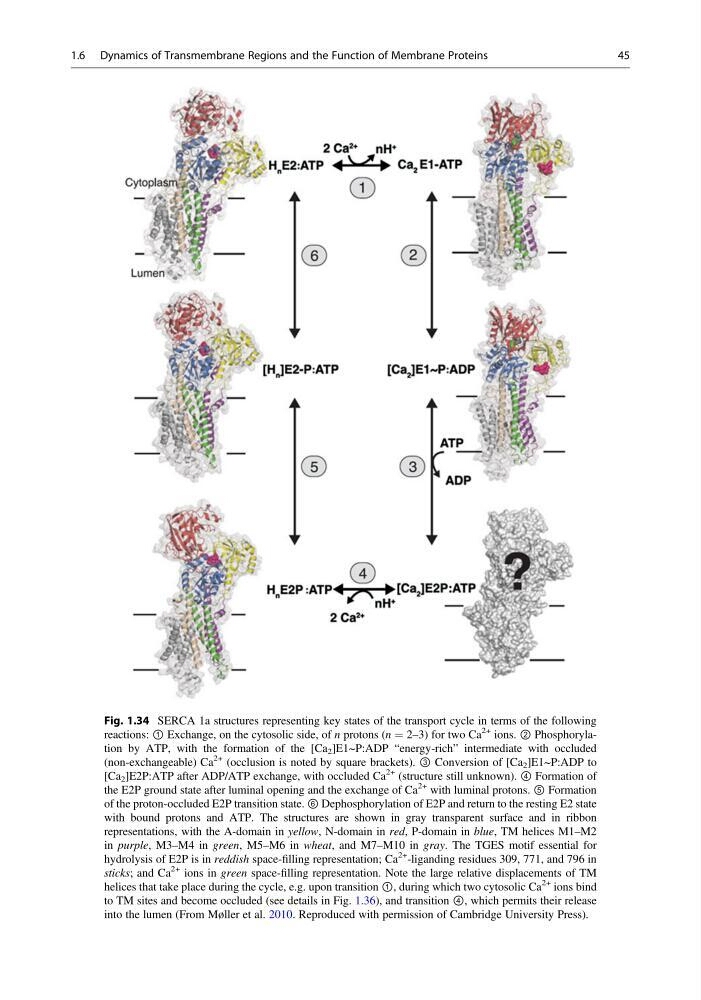
Fig. 1.34 SERCA 1a structures representing key states of the transport cycle in terms of the following
reactions: ① Exchange, on the cytosolic side, of n protons (n ¼ 2–3) for two Ca
2+ ions. ② Phosphorylation by ATP, with the formation of the [Ca 2 ]E1~P:ADP “energy-rich” intermediate with occluded
(non-exchangeable) Ca
2+ (occlusion is noted by square brackets). ③ Conversion of [Ca 2 ]E1~P:ADP to
[Ca 2 ]E2P:ATP after ADP/ATP exchange, with occluded Ca
2+ (structure still unknown). ④ Formation of
the E2P ground state after luminal opening and the exchange of Ca
2+ with luminal protons. ⑤ Formation
of the proton-occluded E2P transition state. ⑥ Dephosphorylation of E2P and return to the resting E2 state
with bound protons and ATP. The structures are shown in gray transparent surface and in ribbon
representations, with the A-domain in yellow, N-domain in red, P-domain in blue, TM helices M1–M2
in purple, M3–M4 in green, M5–M6 in wheat, and M7–M10 in gray. The TGES motif essential for
hydrolysis of E2P is in reddish space-filling representation; Ca
2+ -liganding residues 309, 771, and 796 in
sticks; and Ca
2+ ions in green space-filling representation. Note the large relative displacements of TM
helices that take place during the cycle, e.g. upon transition ①, during which two cytosolic Ca
2+ ions bind
to TM sites and become occluded (see details in Fig. 1.36), and transition ④, which permits their release
into the lumen (From Møller et al. 2010. Reproduced with permission of Cambridge University Press).
1.6 Dynamics of Transmembrane Regions and the Function of Membrane Proteins
45
reactions: ① Exchange, on the cytosolic side, of n protons (n ¼ 2–3) for two Ca
2+ ions. ② Phosphorylation by ATP, with the formation of the [Ca 2 ]E1~P:ADP “energy-rich” intermediate with occluded
(non-exchangeable) Ca
2+ (occlusion is noted by square brackets). ③ Conversion of [Ca 2 ]E1~P:ADP to
[Ca 2 ]E2P:ATP after ADP/ATP exchange, with occluded Ca
2+ (structure still unknown). ④ Formation of
the E2P ground state after luminal opening and the exchange of Ca
2+ with luminal protons. ⑤ Formation
of the proton-occluded E2P transition state. ⑥ Dephosphorylation of E2P and return to the resting E2 state
with bound protons and ATP. The structures are shown in gray transparent surface and in ribbon
representations, with the A-domain in yellow, N-domain in red, P-domain in blue, TM helices M1–M2
in purple, M3–M4 in green, M5–M6 in wheat, and M7–M10 in gray. The TGES motif essential for
hydrolysis of E2P is in reddish space-filling representation; Ca
2+ -liganding residues 309, 771, and 796 in
sticks; and Ca
2+ ions in green space-filling representation. Note the large relative displacements of TM
helices that take place during the cycle, e.g. upon transition ①, during which two cytosolic Ca
2+ ions bind
to TM sites and become occluded (see details in Fig. 1.36), and transition ④, which permits their release
into the lumen (From Møller et al. 2010. Reproduced with permission of Cambridge University Press).
1.6 Dynamics of Transmembrane Regions and the Function of Membrane Proteins
45