

must be deconvoluted to determine the number of conformations present (Smith et al. 2009).
Additionally, collisional activation of the ion species can be performed and the ATDs scrutinized
as a function of input internal energy to monitor unfolding. This can be used to discern if ligand
binding has a stabilizing effect on structure (Allison et al. 2015; Laganowsky et al. 2014;
Eschweiler et al. 2015). IM parameters must be optimized to ensure good ion separation and to
minimize artifacts caused, for example by rollover (where ions from the previous IM pulse have
not exited the mobility cell and reached the TOF before the next ion pulse). The travelling wave
height and velocity parameters in the IM cell should be optimized for each analyte to ensure
rollover does not occur and that good ion separation is achieved over the ms time scale of the IM
experiment (Ruotolo et al. 2008). The gas pressure in the IM cell is typically set to 0.5 mbar;
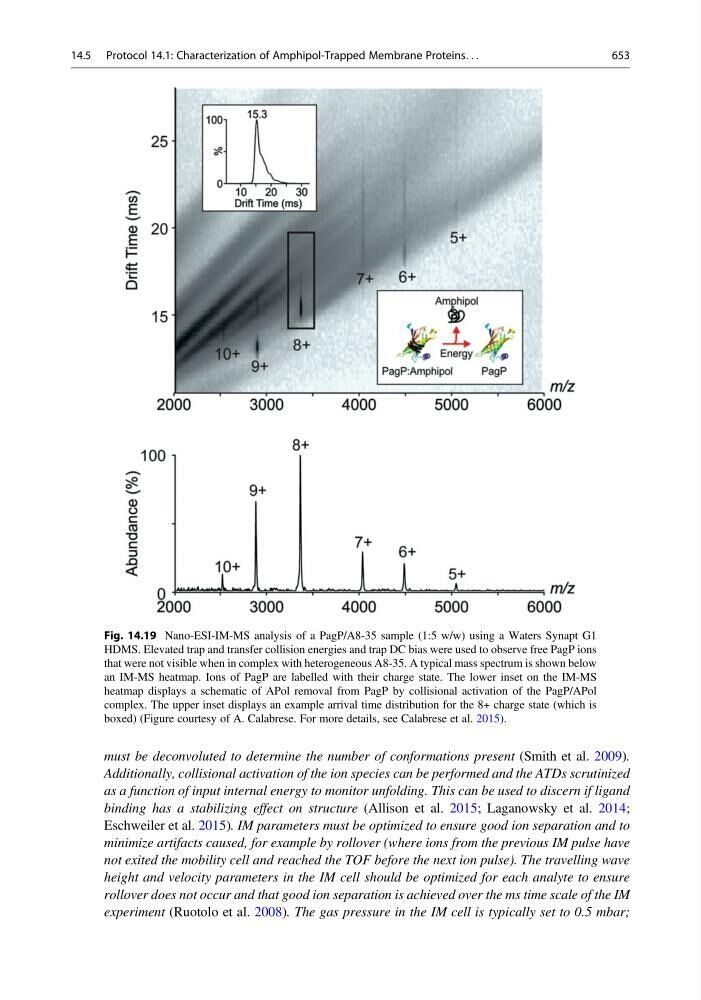
Fig. 14.19 Nano-ESI-IM-MS analysis of a PagP/A8-35 sample (1:5 w/w) using a Waters Synapt G1
HDMS. Elevated trap and transfer collision energies and trap DC bias were used to observe free PagP ions
that were not visible when in complex with heterogeneous A8-35. A typical mass spectrum is shown below
an IM-MS heatmap. Ions of PagP are labelled with their charge state. The lower inset on the IM-MS
heatmap displays a schematic of APol removal from PagP by collisional activation of the PagP/APol
complex. The upper inset displays an example arrival time distribution for the 8+ charge state (which is
boxed) (Figure courtesy of A. Calabrese. For more details, see Calabrese et al. 2015).
14.5 Protocol 14.1: Characterization of Amphipol-Trapped Membrane Proteins. . .
653