

• The m/z scale can be calibrated by spraying a solution of caesium iodide (see Materials) and
processing the data according to the instrument manufacturer’s instructions.
For non-covalent MS of soluble proteins, instrument voltages must be kept gentle to ensure
that protein unfolding is minimized (Hernandez and Robinson 2007; Sobott et al. 2002).
However, for APol-trapped MPs, instrument voltages must be increased and carefully tuned
to ensure that APol molecules are dissociated from the complex and the protein is released
for mass analysis (Fig. 14.18, inset). Optimization of a number of instrument parameters is
essential to ensuring transmission and detection of MP complexes. In our experience, not all
MPs could be observed when trapped with any APol. For example, we have shown that the
outer membrane proteins OmpT, PagP, and tOmpA could all be released from A8-35, but
that release from other APols (A8-75, A34-35, A34-75, SAPol, and NAPol) was variable
(Watkinson et al. 2015). This is likely because the internal energies imparted on the MP/APol
assemblies are insufficient to cause dissociation. In an attempt to overcome this, instruments
have been modified to access higher voltages. Several key parameters to optimize on the
Synapt HDMS are discussed below.
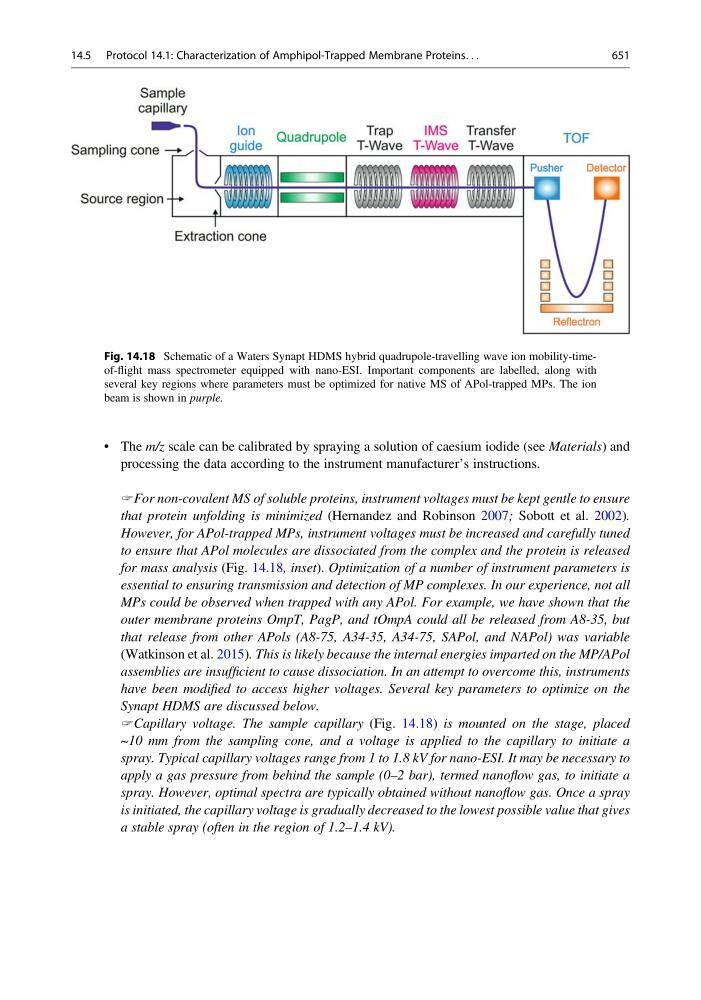
Capillary voltage. The sample capillary (Fig. 14.18) is mounted on the stage, placed
~10 mm from the sampling cone, and a voltage is applied to the capillary to initiate a
spray. Typical capillary voltages range from 1 to 1.8 kV for nano-ESI. It may be necessary to
apply a gas pressure from behind the sample (0–2 bar), termed nanoflow gas, to initiate a
spray. However, optimal spectra are typically obtained without nanoflow gas. Once a spray
is initiated, the capillary voltage is gradually decreased to the lowest possible value that gives
a stable spray (often in the region of 1.2–1.4 kV).
Fig. 14.18 Schematic of a Waters Synapt HDMS hybrid quadrupole-travelling wave ion mobility-timeof-flight mass spectrometer equipped with nano-ESI. Important components are labelled, along with
several key regions where parameters must be optimized for native MS of APol-trapped MPs. The ion
beam is shown in purple.
14.5 Protocol 14.1: Characterization of Amphipol-Trapped Membrane Proteins. . .
651