

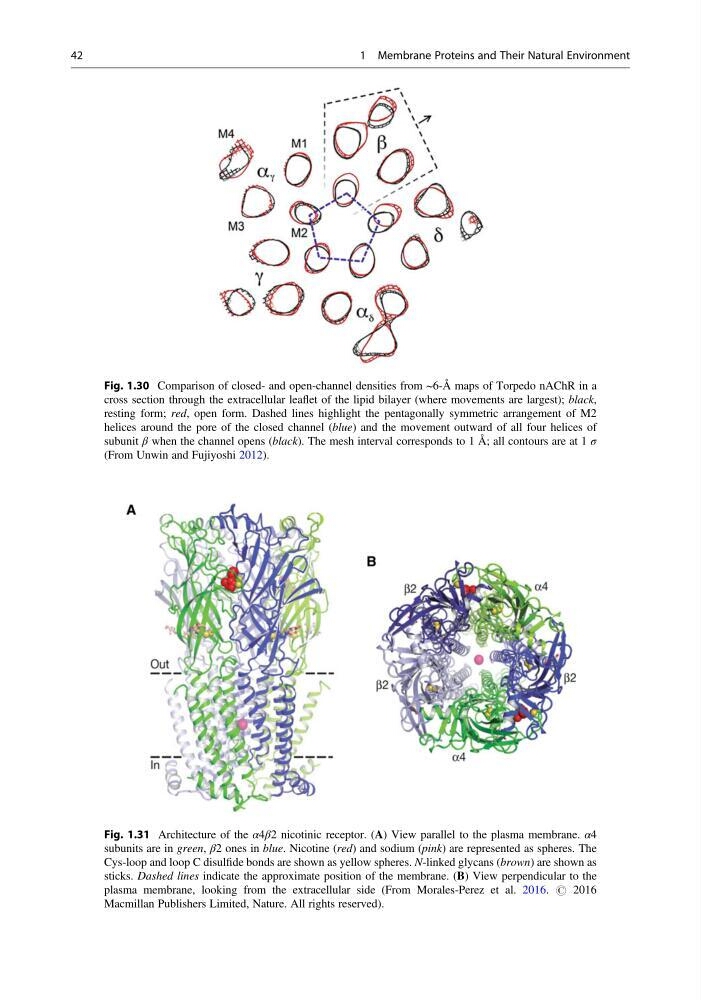
Fig. 1.30 Comparison of closed- and open-channel densities from ~6-Å maps of Torpedo nAChR in a
cross section through the extracellular leaflet of the lipid bilayer (where movements are largest); black,
resting form; red, open form. Dashed lines highlight the pentagonally symmetric arrangement of M2
helices around the pore of the closed channel (blue) and the movement outward of all four helices of
subunit β when the channel opens (black). The mesh interval corresponds to 1 Å; all contours are at 1 σ
(From Unwin and Fujiyoshi 2012).
Fig. 1.31 Architecture of the α4β2 nicotinic receptor. (A) View parallel to the plasma membrane. α4
subunits are in green, β2 ones in blue. Nicotine (red) and sodium (pink) are represented as spheres. The
Cys-loop and loop C disulfide bonds are shown as yellow spheres. N-linked glycans (brown) are shown as
sticks. Dashed lines indicate the approximate position of the membrane. (B) View perpendicular to the
plasma membrane, looking from the extracellular side (From Morales-Perez et al. 2016. # 2016
Macmillan Publishers Limited, Nature. All rights reserved).
42
1 Membrane Proteins and Their Natural Environment
cross section through the extracellular leaflet of the lipid bilayer (where movements are largest); black,
resting form; red, open form. Dashed lines highlight the pentagonally symmetric arrangement of M2
helices around the pore of the closed channel (blue) and the movement outward of all four helices of
subunit β when the channel opens (black). The mesh interval corresponds to 1 Å; all contours are at 1 σ
(From Unwin and Fujiyoshi 2012).
Fig. 1.31 Architecture of the α4β2 nicotinic receptor. (A) View parallel to the plasma membrane. α4
subunits are in green, β2 ones in blue. Nicotine (red) and sodium (pink) are represented as spheres. The
Cys-loop and loop C disulfide bonds are shown as yellow spheres. N-linked glycans (brown) are shown as
sticks. Dashed lines indicate the approximate position of the membrane. (B) View perpendicular to the
plasma membrane, looking from the extracellular side (From Morales-Perez et al. 2016. # 2016
Macmillan Publishers Limited, Nature. All rights reserved).
42
1 Membrane Proteins and Their Natural Environment