

SANS vs. AUC vs. SEC vs. EM Studies of BR/A8-35 Complexes: Consistency and
Inconsistencies
The various approaches used in Study 9.5 provide, in general, consistent estimates of the
composition, size, and mass of monomeric BR/A8-35 complexes. Combining composition and
s-values yields R S % 3.6 nm for both BR/HAPol and BR/DAPol complexes, whereas combining
sedimentation velocity and sedimentation equilibrium data gives R S % 3.8 nm for BR/HAPol
complexes. SANS yields an R g
value for BR/DAPol complexes of ~3.0 nm, which, for spherical
particles, would correspond to R S ¼ R g
 (5/3)
½
% 3.8 nm, in good agreement with AUC data. By
EM, one observes half-widths and half-lengths of ~3.2 and ~4 nm for both BR/HAPol and BR/DAPol
particles (Gohon et al. 2008).
The outlier is SEC, whose estimate of R S is significantly larger (R S % 5.0 Æ 0.15 nm). Earlier
observations had already suggested that, for reasons that are not clear yet, SEC tends to overestimate
the hydrodynamic radius of MP/A8-35 complexes as compared to MP/detergent ones. Indeed, gel
filtration (Zoonens et al. 2007) yields much larger apparent R S differences between tOmpA/A8-35
complexes (R S % 4.3–3.7 nm) and tOmpA/di-C 6 -phosphatidylcholine ones (R S % 2.6 nm) than is
indicated by an NMR study of their respective rotational correlation times, τ c (Zoonens et al. 2005).
The NMR data suggests that SEC overestimates the R S of tOmpA/A8-35 particles by as much as
30–50% (Zoonens et al. 2007), a difference close to that observed for BR in Study 9.5 (~30%).
Electrostatic repulsion between the complexes and resin-bound A8-35 does not seem to account for
this effect (for a discussion, see Zoonens et al. 2007). Note that, in keeping with the latter conclusion,
SEC analysis of BR/non-ionic APol complexes also leads to an overestimation of R S as compared to
AUC data (Sharma et al. 2012). This question is clearly in need of closer investigation.
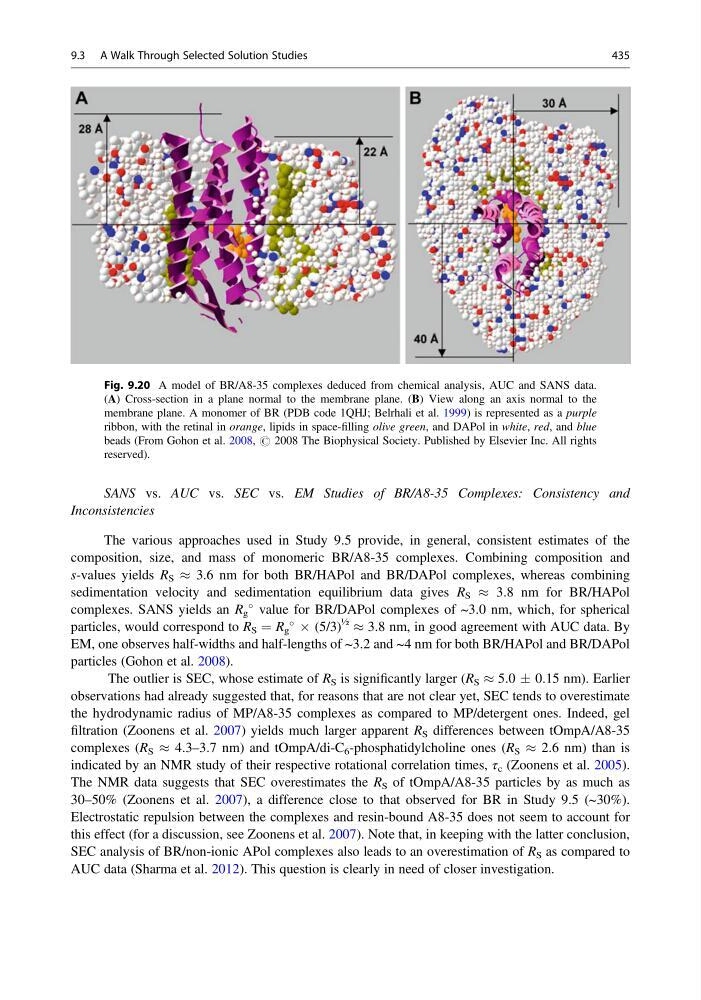
Fig. 9.20 A model of BR/A8-35 complexes deduced from chemical analysis, AUC and SANS data.
(A) Cross-section in a plane normal to the membrane plane. (B) View along an axis normal to the
membrane plane. A monomer of BR (PDB code 1QHJ; Belrhali et al. 1999) is represented as a purple
ribbon, with the retinal in orange, lipids in space-filling olive green, and DAPol in white, red, and blue
beads (From Gohon et al. 2008, # 2008 The Biophysical Society. Published by Elsevier Inc. All rights
reserved).
9.3 A Walk Through Selected Solution Studies
435
Inconsistencies
The various approaches used in Study 9.5 provide, in general, consistent estimates of the
composition, size, and mass of monomeric BR/A8-35 complexes. Combining composition and
s-values yields R S % 3.6 nm for both BR/HAPol and BR/DAPol complexes, whereas combining
sedimentation velocity and sedimentation equilibrium data gives R S % 3.8 nm for BR/HAPol
complexes. SANS yields an R g
value for BR/DAPol complexes of ~3.0 nm, which, for spherical
particles, would correspond to R S ¼ R g
 (5/3)
½
% 3.8 nm, in good agreement with AUC data. By
EM, one observes half-widths and half-lengths of ~3.2 and ~4 nm for both BR/HAPol and BR/DAPol
particles (Gohon et al. 2008).
The outlier is SEC, whose estimate of R S is significantly larger (R S % 5.0 Æ 0.15 nm). Earlier
observations had already suggested that, for reasons that are not clear yet, SEC tends to overestimate
the hydrodynamic radius of MP/A8-35 complexes as compared to MP/detergent ones. Indeed, gel
filtration (Zoonens et al. 2007) yields much larger apparent R S differences between tOmpA/A8-35
complexes (R S % 4.3–3.7 nm) and tOmpA/di-C 6 -phosphatidylcholine ones (R S % 2.6 nm) than is
indicated by an NMR study of their respective rotational correlation times, τ c (Zoonens et al. 2005).
The NMR data suggests that SEC overestimates the R S of tOmpA/A8-35 particles by as much as
30–50% (Zoonens et al. 2007), a difference close to that observed for BR in Study 9.5 (~30%).
Electrostatic repulsion between the complexes and resin-bound A8-35 does not seem to account for
this effect (for a discussion, see Zoonens et al. 2007). Note that, in keeping with the latter conclusion,
SEC analysis of BR/non-ionic APol complexes also leads to an overestimation of R S as compared to
AUC data (Sharma et al. 2012). This question is clearly in need of closer investigation.
Fig. 9.20 A model of BR/A8-35 complexes deduced from chemical analysis, AUC and SANS data.
(A) Cross-section in a plane normal to the membrane plane. (B) View along an axis normal to the
membrane plane. A monomer of BR (PDB code 1QHJ; Belrhali et al. 1999) is represented as a purple
ribbon, with the retinal in orange, lipids in space-filling olive green, and DAPol in white, red, and blue
beads (From Gohon et al. 2008, # 2008 The Biophysical Society. Published by Elsevier Inc. All rights
reserved).
9.3 A Walk Through Selected Solution Studies
435