

small amounts of very large aggregates of pure DAPol, as observed in pure DAPol preparations
(Gohon et al. 2006; see Chap. 4, § 4.3.1.2, Fig. 4.14). The aggregates stand out because of their large
size (> 1 MDa; Gohon et al. 2006), as compared to ~90 kDa (see below) for the BR/A8-35 complexes.
Had their presence been known in advance, they could have been removed by either filtration or
ultracentrifugation of the stock solution of DAPol. However, they barely affect the analysis, because of
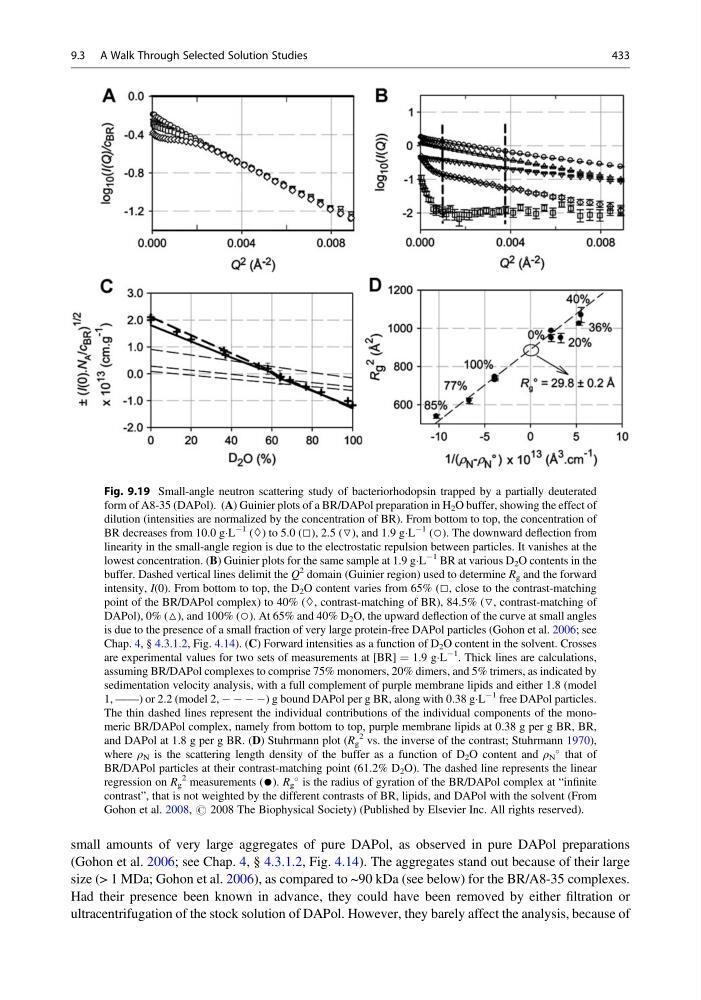
Fig. 9.19 Small-angle neutron scattering study of bacteriorhodopsin trapped by a partially deuterated
form of A8-35 (DAPol). (A) Guinier plots of a BR/DAPol preparation in H 2 O buffer, showing the effect of
dilution (intensities are normalized by the concentration of BR). From bottom to top, the concentration of
BR decreases from 10.0 gÁL
À1 (◊) to 5.0 (□), 2.5 (▽), and 1.9 gÁL
À1 (○). The downward deflection from
linearity in the small-angle region is due to the electrostatic repulsion between particles. It vanishes at the
lowest concentration. (B) Guinier plots for the same sample at 1.9 gÁL
À1 BR at various D 2 O contents in the
buffer. Dashed vertical lines delimit the Q
2 domain (Guinier region) used to determine R g and the forward
intensity, I(0). From bottom to top, the D 2 O content varies from 65% (□, close to the contrast-matching
point of the BR/DAPol complex) to 40% (◊, contrast-matching of BR), 84.5% (▽, contrast-matching of
DAPol), 0% (△), and 100% (○). At 65% and 40% D 2 O, the upward deflection of the curve at small angles
is due to the presence of a small fraction of very large protein-free DAPol particles (Gohon et al. 2006; see
Chap. 4, § 4.3.1.2, Fig. 4.14). (C) Forward intensities as a function of D 2 O content in the solvent. Crosses
are experimental values for two sets of measurements at [BR] ¼ 1.9 gÁL
À1
. Thick lines are calculations,
assuming BR/DAPol complexes to comprise 75% monomers, 20% dimers, and 5% trimers, as indicated by
sedimentation velocity analysis, with a full complement of purple membrane lipids and either 1.8 (model
1, ——) or 2.2 (model 2, À À À À) g bound DAPol per g BR, along with 0.38 gÁL
À1 free DAPol particles.
The thin dashed lines represent the individual contributions of the individual components of the monomeric BR/DAPol complex, namely from bottom to top, purple membrane lipids at 0.38 g per g BR, BR,
and DAPol at 1.8 g per g BR. (D) Stuhrmann plot (R g
2 vs. the inverse of the contrast; Stuhrmann 1970),
where ρ N is the scattering length density of the buffer as a function of D 2 O content and ρ N
that of
BR/DAPol particles at their contrast-matching point (61.2% D 2 O). The dashed line represents the linear
regression on R g
2 measurements (●). R g
is the radius of gyration of the BR/DAPol complex at “infinite
contrast”, that is not weighted by the different contrasts of BR, lipids, and DAPol with the solvent (From
Gohon et al. 2008, # 2008 The Biophysical Society) (Published by Elsevier Inc. All rights reserved).
9.3 A Walk Through Selected Solution Studies
433
(Gohon et al. 2006; see Chap. 4, § 4.3.1.2, Fig. 4.14). The aggregates stand out because of their large
size (> 1 MDa; Gohon et al. 2006), as compared to ~90 kDa (see below) for the BR/A8-35 complexes.
Had their presence been known in advance, they could have been removed by either filtration or
ultracentrifugation of the stock solution of DAPol. However, they barely affect the analysis, because of
Fig. 9.19 Small-angle neutron scattering study of bacteriorhodopsin trapped by a partially deuterated
form of A8-35 (DAPol). (A) Guinier plots of a BR/DAPol preparation in H 2 O buffer, showing the effect of
dilution (intensities are normalized by the concentration of BR). From bottom to top, the concentration of
BR decreases from 10.0 gÁL
À1 (◊) to 5.0 (□), 2.5 (▽), and 1.9 gÁL
À1 (○). The downward deflection from
linearity in the small-angle region is due to the electrostatic repulsion between particles. It vanishes at the
lowest concentration. (B) Guinier plots for the same sample at 1.9 gÁL
À1 BR at various D 2 O contents in the
buffer. Dashed vertical lines delimit the Q
2 domain (Guinier region) used to determine R g and the forward
intensity, I(0). From bottom to top, the D 2 O content varies from 65% (□, close to the contrast-matching
point of the BR/DAPol complex) to 40% (◊, contrast-matching of BR), 84.5% (▽, contrast-matching of
DAPol), 0% (△), and 100% (○). At 65% and 40% D 2 O, the upward deflection of the curve at small angles
is due to the presence of a small fraction of very large protein-free DAPol particles (Gohon et al. 2006; see
Chap. 4, § 4.3.1.2, Fig. 4.14). (C) Forward intensities as a function of D 2 O content in the solvent. Crosses
are experimental values for two sets of measurements at [BR] ¼ 1.9 gÁL
À1
. Thick lines are calculations,
assuming BR/DAPol complexes to comprise 75% monomers, 20% dimers, and 5% trimers, as indicated by
sedimentation velocity analysis, with a full complement of purple membrane lipids and either 1.8 (model
1, ——) or 2.2 (model 2, À À À À) g bound DAPol per g BR, along with 0.38 gÁL
À1 free DAPol particles.
The thin dashed lines represent the individual contributions of the individual components of the monomeric BR/DAPol complex, namely from bottom to top, purple membrane lipids at 0.38 g per g BR, BR,
and DAPol at 1.8 g per g BR. (D) Stuhrmann plot (R g
2 vs. the inverse of the contrast; Stuhrmann 1970),
where ρ N is the scattering length density of the buffer as a function of D 2 O content and ρ N
that of
BR/DAPol particles at their contrast-matching point (61.2% D 2 O). The dashed line represents the linear
regression on R g
2 measurements (●). R g
is the radius of gyration of the BR/DAPol complex at “infinite
contrast”, that is not weighted by the different contrasts of BR, lipids, and DAPol with the solvent (From
Gohon et al. 2008, # 2008 The Biophysical Society) (Published by Elsevier Inc. All rights reserved).
9.3 A Walk Through Selected Solution Studies
433