

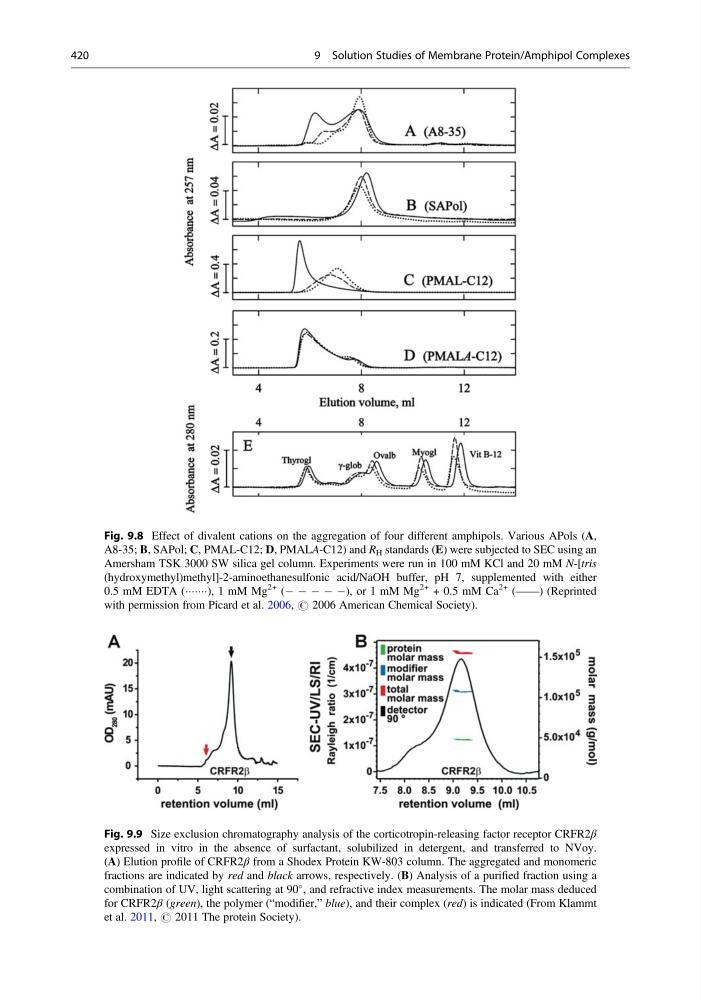
Fig. 9.8 Effect of divalent cations on the aggregation of four different amphipols. Various APols (A,
A8-35; B, SAPol; C, PMAL-C12; D, PMALA-C12) and R H standards (E) were subjected to SEC using an
Amersham TSK 3000 SW silica gel column. Experiments were run in 100 mM KCl and 20 mM N-[tris
(hydroxymethyl)methyl]-2-aminoethanesulfonic acid/NaOH buffer, pH 7, supplemented with either
0.5 mM EDTA (ÁÁÁÁÁÁÁ), 1 mM Mg
2+ (À À À À À), or 1 mM Mg
2+ + 0.5 mM Ca
2+ (——) (Reprinted
with permission from Picard et al. 2006, # 2006 American Chemical Society).
Fig. 9.9 Size exclusion chromatography analysis of the corticotropin-releasing factor receptor CRFR2β
expressed in vitro in the absence of surfactant, solubilized in detergent, and transferred to NVoy.
(A) Elution profile of CRFR2β from a Shodex Protein KW-803 column. The aggregated and monomeric
fractions are indicated by red and black arrows, respectively. (B) Analysis of a purified fraction using a
combination of UV, light scattering at 90
, and refractive index measurements. The molar mass deduced
for CRFR2β (green), the polymer (“modifier,” blue), and their complex (red) is indicated (From Klammt
et al. 2011, # 2011 The protein Society).
420
9 Solution Studies of Membrane Protein/Amphipol Complexes
A8-35; B, SAPol; C, PMAL-C12; D, PMALA-C12) and R H standards (E) were subjected to SEC using an
Amersham TSK 3000 SW silica gel column. Experiments were run in 100 mM KCl and 20 mM N-[tris
(hydroxymethyl)methyl]-2-aminoethanesulfonic acid/NaOH buffer, pH 7, supplemented with either
0.5 mM EDTA (ÁÁÁÁÁÁÁ), 1 mM Mg
2+ (À À À À À), or 1 mM Mg
2+ + 0.5 mM Ca
2+ (——) (Reprinted
with permission from Picard et al. 2006, # 2006 American Chemical Society).
Fig. 9.9 Size exclusion chromatography analysis of the corticotropin-releasing factor receptor CRFR2β
expressed in vitro in the absence of surfactant, solubilized in detergent, and transferred to NVoy.
(A) Elution profile of CRFR2β from a Shodex Protein KW-803 column. The aggregated and monomeric
fractions are indicated by red and black arrows, respectively. (B) Analysis of a purified fraction using a
combination of UV, light scattering at 90
, and refractive index measurements. The molar mass deduced
for CRFR2β (green), the polymer (“modifier,” blue), and their complex (red) is indicated (From Klammt
et al. 2011, # 2011 The protein Society).
420
9 Solution Studies of Membrane Protein/Amphipol Complexes