

protein and the polymer. However, these two limitations can be circumvented using a combination of
resonance Raman spectroscopy (RRS) and surface-enhanced Raman spectroscopy (SERS). SERS
exploits the enhancement observed when the target molecule is in close proximity of noble metal
nanoparticles, whereas RRS builds on that resulting from exciting the electronic transitions of a
chromophore present in it. When combining the two approaches, signals from the vibrational modes
of bonds within the chromophore or between the protein and the chromophore can be amplified up to
10
14
–10
15
 as compared to conventional Raman measurements, making the detection of single
molecules possible (Box 8.1). SERS of membrane-associated BR has been studied using purple
membrane patches adsorbed onto silver electrodes (Nabiev et al. 1985, 1990).
The potential usefulness of APols for SERS studies of MPs has been explored in Study 8.27
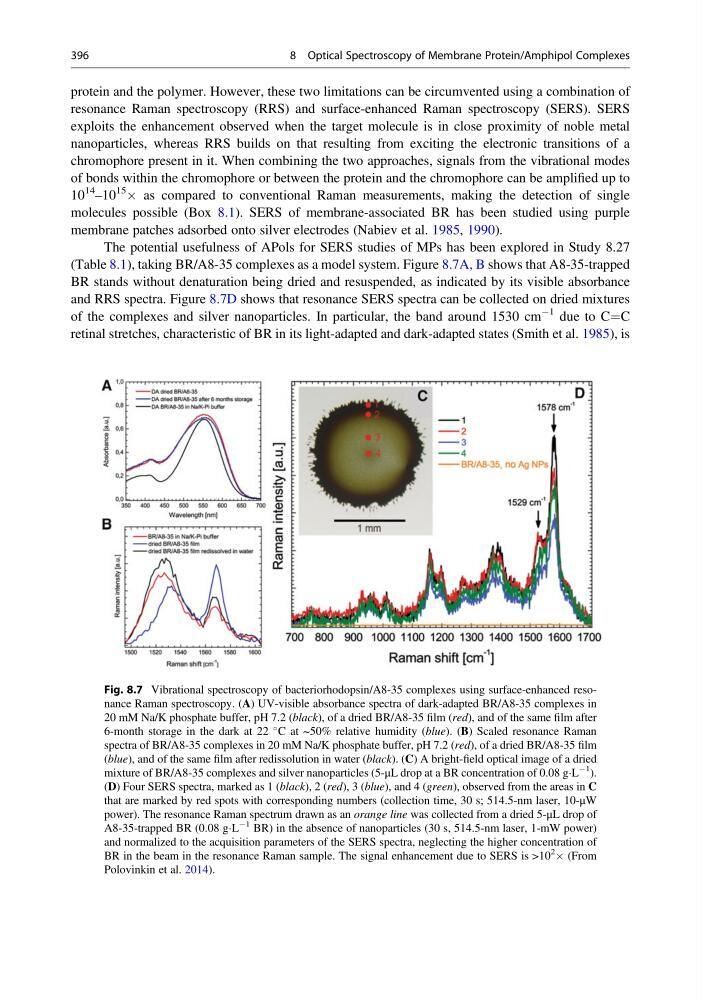
(Table 8.1), taking BR/A8-35 complexes as a model system. Figure 8.7A, B shows that A8-35-trapped
BR stands without denaturation being dried and resuspended, as indicated by its visible absorbance
and RRS spectra. Figure 8.7D shows that resonance SERS spectra can be collected on dried mixtures
of the complexes and silver nanoparticles. In particular, the band around 1530 cm
À1 due to C¼C
retinal stretches, characteristic of BR in its light-adapted and dark-adapted states (Smith et al. 1985), is
Fig. 8.7 Vibrational spectroscopy of bacteriorhodopsin/A8-35 complexes using surface-enhanced resonance Raman spectroscopy. (A) UV-visible absorbance spectra of dark-adapted BR/A8-35 complexes in
20 mM Na/K phosphate buffer, pH 7.2 (black), of a dried BR/A8-35 film (red), and of the same film after
6-month storage in the dark at 22
C at ~50% relative humidity (blue). (B) Scaled resonance Raman
spectra of BR/A8-35 complexes in 20 mM Na/K phosphate buffer, pH 7.2 (red), of a dried BR/A8-35 film
(blue), and of the same film after redissolution in water (black). (C) A bright-field optical image of a dried
mixture of BR/A8-35 complexes and silver nanoparticles (5-μL drop at a BR concentration of 0.08 gÁL
À1
).
(D) Four SERS spectra, marked as 1 (black), 2 (red), 3 (blue), and 4 (green), observed from the areas in C
that are marked by red spots with corresponding numbers (collection time, 30 s; 514.5-nm laser, 10-μW
power). The resonance Raman spectrum drawn as an orange line was collected from a dried 5-μL drop of
A8-35-trapped BR (0.08 gÁL
À1 BR) in the absence of nanoparticles (30 s, 514.5-nm laser, 1-mW power)
and normalized to the acquisition parameters of the SERS spectra, neglecting the higher concentration of
BR in the beam in the resonance Raman sample. The signal enhancement due to SERS is >10
2
 (From
Polovinkin et al. 2014).
396
8 Optical Spectroscopy of Membrane Protein/Amphipol Complexes
resonance Raman spectroscopy (RRS) and surface-enhanced Raman spectroscopy (SERS). SERS
exploits the enhancement observed when the target molecule is in close proximity of noble metal
nanoparticles, whereas RRS builds on that resulting from exciting the electronic transitions of a
chromophore present in it. When combining the two approaches, signals from the vibrational modes
of bonds within the chromophore or between the protein and the chromophore can be amplified up to
10
14
–10
15
 as compared to conventional Raman measurements, making the detection of single
molecules possible (Box 8.1). SERS of membrane-associated BR has been studied using purple
membrane patches adsorbed onto silver electrodes (Nabiev et al. 1985, 1990).
The potential usefulness of APols for SERS studies of MPs has been explored in Study 8.27
(Table 8.1), taking BR/A8-35 complexes as a model system. Figure 8.7A, B shows that A8-35-trapped
BR stands without denaturation being dried and resuspended, as indicated by its visible absorbance
and RRS spectra. Figure 8.7D shows that resonance SERS spectra can be collected on dried mixtures
of the complexes and silver nanoparticles. In particular, the band around 1530 cm
À1 due to C¼C
retinal stretches, characteristic of BR in its light-adapted and dark-adapted states (Smith et al. 1985), is
Fig. 8.7 Vibrational spectroscopy of bacteriorhodopsin/A8-35 complexes using surface-enhanced resonance Raman spectroscopy. (A) UV-visible absorbance spectra of dark-adapted BR/A8-35 complexes in
20 mM Na/K phosphate buffer, pH 7.2 (black), of a dried BR/A8-35 film (red), and of the same film after
6-month storage in the dark at 22
C at ~50% relative humidity (blue). (B) Scaled resonance Raman
spectra of BR/A8-35 complexes in 20 mM Na/K phosphate buffer, pH 7.2 (red), of a dried BR/A8-35 film
(blue), and of the same film after redissolution in water (black). (C) A bright-field optical image of a dried
mixture of BR/A8-35 complexes and silver nanoparticles (5-μL drop at a BR concentration of 0.08 gÁL
À1
).
(D) Four SERS spectra, marked as 1 (black), 2 (red), 3 (blue), and 4 (green), observed from the areas in C
that are marked by red spots with corresponding numbers (collection time, 30 s; 514.5-nm laser, 10-μW
power). The resonance Raman spectrum drawn as an orange line was collected from a dried 5-μL drop of
A8-35-trapped BR (0.08 gÁL
À1 BR) in the absence of nanoparticles (30 s, 514.5-nm laser, 1-mW power)
and normalized to the acquisition parameters of the SERS spectra, neglecting the higher concentration of
BR in the beam in the resonance Raman sample. The signal enhancement due to SERS is >10
2
 (From
Polovinkin et al. 2014).
396
8 Optical Spectroscopy of Membrane Protein/Amphipol Complexes