

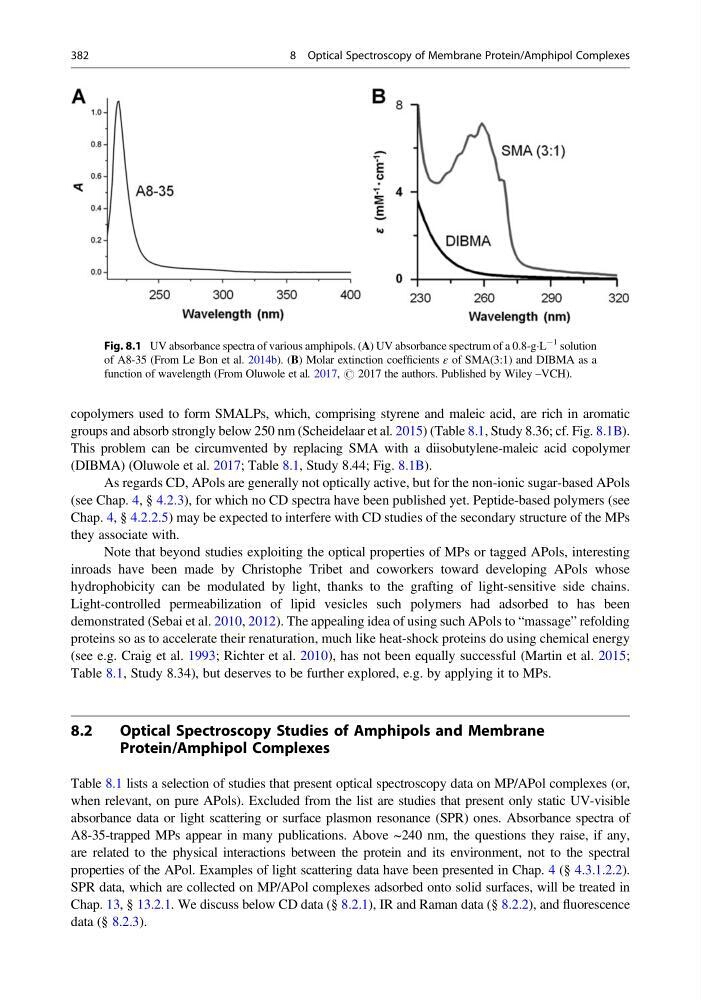
copolymers used to form SMALPs, which, comprising styrene and maleic acid, are rich in aromatic
groups and absorb strongly below 250 nm (Scheidelaar et al. 2015) (Table 8.1, Study 8.36; cf. Fig. 8.1B).
This problem can be circumvented by replacing SMA with a diisobutylene-maleic acid copolymer
(DIBMA) (Oluwole et al. 2017; Table 8.1, Study 8.44; Fig. 8.1B).
As regards CD, APols are generally not optically active, but for the non-ionic sugar-based APols
(see Chap. 4, § 4.2.3), for which no CD spectra have been published yet. Peptide-based polymers (see
Chap. 4, § 4.2.2.5) may be expected to interfere with CD studies of the secondary structure of the MPs
they associate with.
Note that beyond studies exploiting the optical properties of MPs or tagged APols, interesting
inroads have been made by Christophe Tribet and coworkers toward developing APols whose
hydrophobicity can be modulated by light, thanks to the grafting of light-sensitive side chains.
Light-controlled permeabilization of lipid vesicles such polymers had adsorbed to has been
demonstrated (Sebai et al. 2010, 2012). The appealing idea of using such APols to “massage” refolding
proteins so as to accelerate their renaturation, much like heat-shock proteins do using chemical energy
(see e.g. Craig et al. 1993; Richter et al. 2010), has not been equally successful (Martin et al. 2015;
Table 8.1, Study 8.34), but deserves to be further explored, e.g. by applying it to MPs.
8.2
Optical Spectroscopy Studies of Amphipols and Membrane
Protein/Amphipol Complexes
Table 8.1 lists a selection of studies that present optical spectroscopy data on MP/APol complexes (or,
when relevant, on pure APols). Excluded from the list are studies that present only static UV-visible
absorbance data or light scattering or surface plasmon resonance (SPR) ones. Absorbance spectra of
A8-35-trapped MPs appear in many publications. Above ~240 nm, the questions they raise, if any,
are related to the physical interactions between the protein and its environment, not to the spectral
properties of the APol. Examples of light scattering data have been presented in Chap. 4 (§ 4.3.1.2.2).
SPR data, which are collected on MP/APol complexes adsorbed onto solid surfaces, will be treated in
Chap. 13, § 13.2.1. We discuss below CD data (§ 8.2.1), IR and Raman data (§ 8.2.2), and fluorescence
data (§ 8.2.3).
Fig. 8.1 UV absorbance spectra of various amphipols. (A) UV absorbance spectrum of a 0.8-gÁL
À1 solution
of A8-35 (From Le Bon et al. 2014b). (B) Molar extinction coefficients ε of SMA(3:1) and DIBMA as a
function of wavelength (From Oluwole et al. 2017, # 2017 the authors. Published by Wiley –VCH).
382
8 Optical Spectroscopy of Membrane Protein/Amphipol Complexes
groups and absorb strongly below 250 nm (Scheidelaar et al. 2015) (Table 8.1, Study 8.36; cf. Fig. 8.1B).
This problem can be circumvented by replacing SMA with a diisobutylene-maleic acid copolymer
(DIBMA) (Oluwole et al. 2017; Table 8.1, Study 8.44; Fig. 8.1B).
As regards CD, APols are generally not optically active, but for the non-ionic sugar-based APols
(see Chap. 4, § 4.2.3), for which no CD spectra have been published yet. Peptide-based polymers (see
Chap. 4, § 4.2.2.5) may be expected to interfere with CD studies of the secondary structure of the MPs
they associate with.
Note that beyond studies exploiting the optical properties of MPs or tagged APols, interesting
inroads have been made by Christophe Tribet and coworkers toward developing APols whose
hydrophobicity can be modulated by light, thanks to the grafting of light-sensitive side chains.
Light-controlled permeabilization of lipid vesicles such polymers had adsorbed to has been
demonstrated (Sebai et al. 2010, 2012). The appealing idea of using such APols to “massage” refolding
proteins so as to accelerate their renaturation, much like heat-shock proteins do using chemical energy
(see e.g. Craig et al. 1993; Richter et al. 2010), has not been equally successful (Martin et al. 2015;
Table 8.1, Study 8.34), but deserves to be further explored, e.g. by applying it to MPs.
8.2
Optical Spectroscopy Studies of Amphipols and Membrane
Protein/Amphipol Complexes
Table 8.1 lists a selection of studies that present optical spectroscopy data on MP/APol complexes (or,
when relevant, on pure APols). Excluded from the list are studies that present only static UV-visible
absorbance data or light scattering or surface plasmon resonance (SPR) ones. Absorbance spectra of
A8-35-trapped MPs appear in many publications. Above ~240 nm, the questions they raise, if any,
are related to the physical interactions between the protein and its environment, not to the spectral
properties of the APol. Examples of light scattering data have been presented in Chap. 4 (§ 4.3.1.2.2).
SPR data, which are collected on MP/APol complexes adsorbed onto solid surfaces, will be treated in
Chap. 13, § 13.2.1. We discuss below CD data (§ 8.2.1), IR and Raman data (§ 8.2.2), and fluorescence
data (§ 8.2.3).
Fig. 8.1 UV absorbance spectra of various amphipols. (A) UV absorbance spectrum of a 0.8-gÁL
À1 solution
of A8-35 (From Le Bon et al. 2014b). (B) Molar extinction coefficients ε of SMA(3:1) and DIBMA as a
function of wavelength (From Oluwole et al. 2017, # 2017 the authors. Published by Wiley –VCH).
382
8 Optical Spectroscopy of Membrane Protein/Amphipol Complexes