

appears paradoxical and remains to be understood. A model of the BR/lipid/A8-35 complex based on
compositional, AUC and SANS data is shown in Chap. 9, Fig. 9.18.
A similar study (Study 5.17 in Table 5.4) has been carried out on complexes between BR
and a glucosylated NAPol (Sharma et al. 2012). The conclusions were essentially the same, except
that (i) the mass of APol bound is significantly higher (~97 kDa, putting the total mass of the complex
at ~135 kDa), even though the content in APol n-alkyl chains is only slightly higher (~136 C 11 chains
for BR/NAPol complexes vs. ~110 C 8 ones for BR/A8-35 ones; Table 5.5); (ii) due to the higher
density of NAPols, the specific volume of the complexes is lower (0.791 mLÁg
À1 vs. 0.856 mLÁg
À1 for
BR/A8-35 complexes); and (iii) the R S is slightly higher (4.1 nm) and is identical whether determined
by AUC or by SEC. The NAPol belt that keeps BR soluble is therefore slightly thicker than that formed
by A8-35. A model of BR/lipid/NAPol complexes based on this ensemble of data is shown in Chap. 9,
Fig. 9.19.
An interesting comparison has been carried out in Study 5.56 (Table 5.4) between SAXS and
SANS data and low-resolution EM images of A8-35-trapped ExbB 4 /ExbD 2 complexes (Sverzhinsky
et al. 2014; see Chap. 9, § 9.3.8.3, Fig. 9.21).
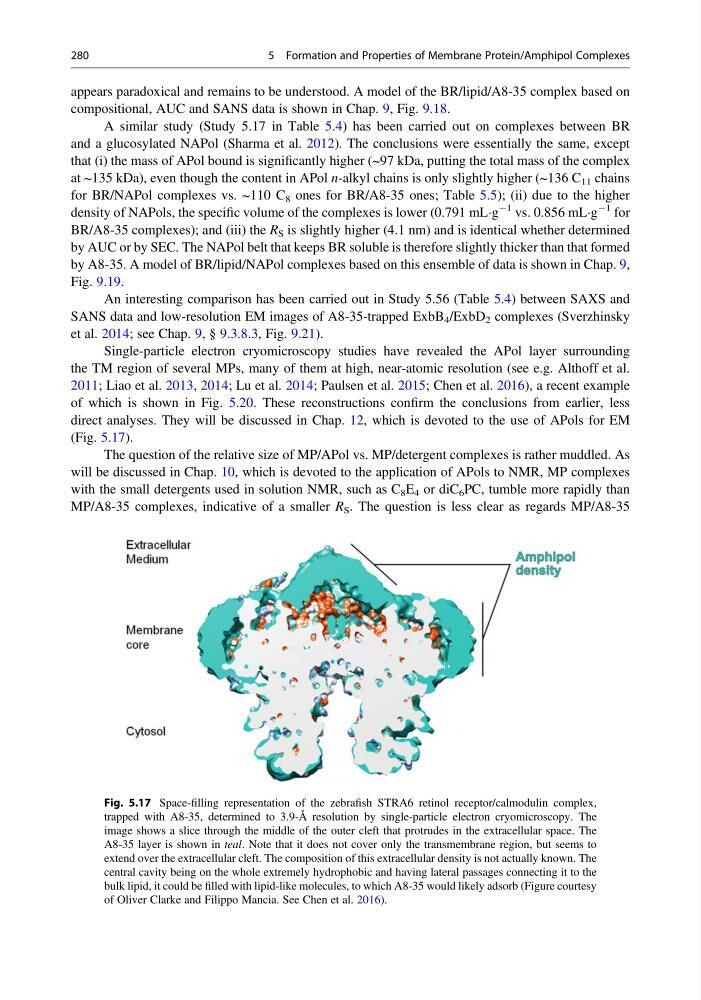
Single-particle electron cryomicroscopy studies have revealed the APol layer surrounding
the TM region of several MPs, many of them at high, near-atomic resolution (see e.g. Althoff et al.
2011; Liao et al. 2013, 2014; Lu et al. 2014; Paulsen et al. 2015; Chen et al. 2016), a recent example
of which is shown in Fig. 5.20. These reconstructions confirm the conclusions from earlier, less
direct analyses. They will be discussed in Chap. 12, which is devoted to the use of APols for EM
(Fig. 5.17).
The question of the relative size of MP/APol vs. MP/detergent complexes is rather muddled. As
will be discussed in Chap. 10, which is devoted to the application of APols to NMR, MP complexes
with the small detergents used in solution NMR, such as C 8 E 4 or diC 6 PC, tumble more rapidly than
MP/A8-35 complexes, indicative of a smaller R S . The question is less clear as regards MP/A8-35
Fig. 5.17 Space-filling representation of the zebrafish STRA6 retinol receptor/calmodulin complex,
trapped with A8-35, determined to 3.9-Å resolution by single-particle electron cryomicroscopy. The
image shows a slice through the middle of the outer cleft that protrudes in the extracellular space. The
A8-35 layer is shown in teal. Note that it does not cover only the transmembrane region, but seems to
extend over the extracellular cleft. The composition of this extracellular density is not actually known. The
central cavity being on the whole extremely hydrophobic and having lateral passages connecting it to the
bulk lipid, it could be filled with lipid-like molecules, to which A8-35 would likely adsorb (Figure courtesy
of Oliver Clarke and Filippo Mancia. See Chen et al. 2016).
280
5 Formation and Properties of Membrane Protein/Amphipol Complexes
compositional, AUC and SANS data is shown in Chap. 9, Fig. 9.18.
A similar study (Study 5.17 in Table 5.4) has been carried out on complexes between BR
and a glucosylated NAPol (Sharma et al. 2012). The conclusions were essentially the same, except
that (i) the mass of APol bound is significantly higher (~97 kDa, putting the total mass of the complex
at ~135 kDa), even though the content in APol n-alkyl chains is only slightly higher (~136 C 11 chains
for BR/NAPol complexes vs. ~110 C 8 ones for BR/A8-35 ones; Table 5.5); (ii) due to the higher
density of NAPols, the specific volume of the complexes is lower (0.791 mLÁg
À1 vs. 0.856 mLÁg
À1 for
BR/A8-35 complexes); and (iii) the R S is slightly higher (4.1 nm) and is identical whether determined
by AUC or by SEC. The NAPol belt that keeps BR soluble is therefore slightly thicker than that formed
by A8-35. A model of BR/lipid/NAPol complexes based on this ensemble of data is shown in Chap. 9,
Fig. 9.19.
An interesting comparison has been carried out in Study 5.56 (Table 5.4) between SAXS and
SANS data and low-resolution EM images of A8-35-trapped ExbB 4 /ExbD 2 complexes (Sverzhinsky
et al. 2014; see Chap. 9, § 9.3.8.3, Fig. 9.21).
Single-particle electron cryomicroscopy studies have revealed the APol layer surrounding
the TM region of several MPs, many of them at high, near-atomic resolution (see e.g. Althoff et al.
2011; Liao et al. 2013, 2014; Lu et al. 2014; Paulsen et al. 2015; Chen et al. 2016), a recent example
of which is shown in Fig. 5.20. These reconstructions confirm the conclusions from earlier, less
direct analyses. They will be discussed in Chap. 12, which is devoted to the use of APols for EM
(Fig. 5.17).
The question of the relative size of MP/APol vs. MP/detergent complexes is rather muddled. As
will be discussed in Chap. 10, which is devoted to the application of APols to NMR, MP complexes
with the small detergents used in solution NMR, such as C 8 E 4 or diC 6 PC, tumble more rapidly than
MP/A8-35 complexes, indicative of a smaller R S . The question is less clear as regards MP/A8-35
Fig. 5.17 Space-filling representation of the zebrafish STRA6 retinol receptor/calmodulin complex,
trapped with A8-35, determined to 3.9-Å resolution by single-particle electron cryomicroscopy. The
image shows a slice through the middle of the outer cleft that protrudes in the extracellular space. The
A8-35 layer is shown in teal. Note that it does not cover only the transmembrane region, but seems to
extend over the extracellular cleft. The composition of this extracellular density is not actually known. The
central cavity being on the whole extremely hydrophobic and having lateral passages connecting it to the
bulk lipid, it could be filled with lipid-like molecules, to which A8-35 would likely adsorb (Figure courtesy
of Oliver Clarke and Filippo Mancia. See Chen et al. 2016).
280
5 Formation and Properties of Membrane Protein/Amphipol Complexes