

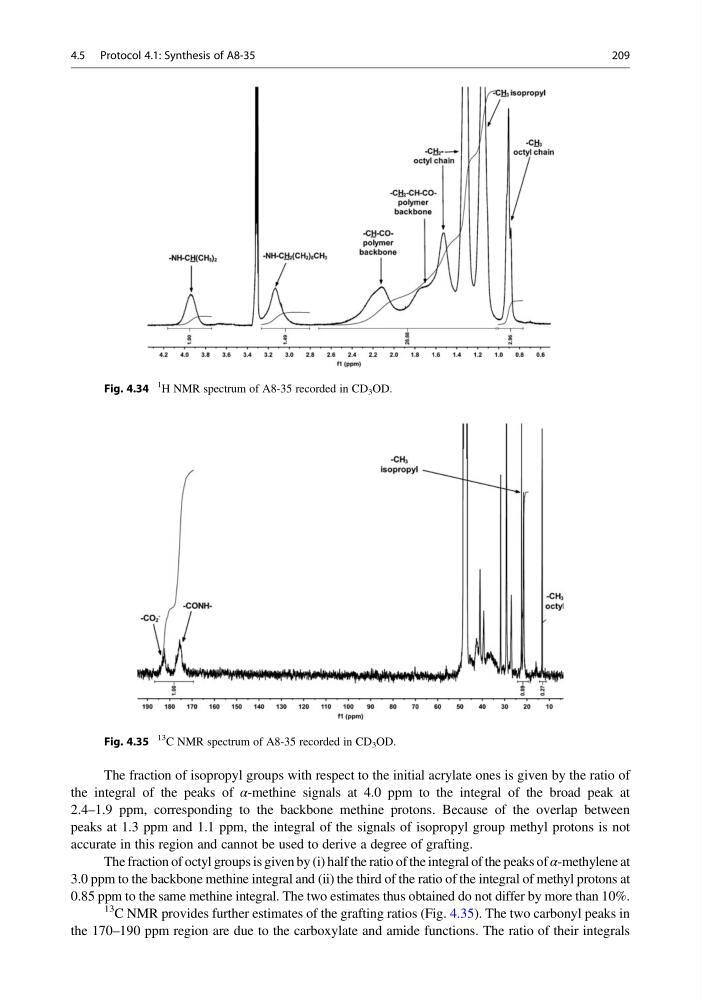
The fraction of isopropyl groups with respect to the initial acrylate ones is given by the ratio of
the integral of the peaks of α-methine signals at 4.0 ppm to the integral of the broad peak at
2.4–1.9 ppm, corresponding to the backbone methine protons. Because of the overlap between
peaks at 1.3 ppm and 1.1 ppm, the integral of the signals of isopropyl group methyl protons is not
accurate in this region and cannot be used to derive a degree of grafting.
The fraction of octyl groups is given by (i) half the ratio of the integral of the peaks of α-methylene at
3.0 ppm to the backbone methine integral and (ii) the third of the ratio of the integral of methyl protons at
0.85 ppm to the same methine integral. The two estimates thus obtained do not differ by more than 10%.
13 C NMR provides further estimates of the grafting ratios (Fig. 4.35). The two carbonyl peaks in
the 170–190 ppm region are due to the carboxylate and amide functions. The ratio of their integrals
Fig. 4.34
1
H NMR spectrum of A8-35 recorded in CD 3 OD.
Fig. 4.35
13
C NMR spectrum of A8-35 recorded in CD 3 OD.
4.5 Protocol 4.1: Synthesis of A8-35
209
the integral of the peaks of α-methine signals at 4.0 ppm to the integral of the broad peak at
2.4–1.9 ppm, corresponding to the backbone methine protons. Because of the overlap between
peaks at 1.3 ppm and 1.1 ppm, the integral of the signals of isopropyl group methyl protons is not
accurate in this region and cannot be used to derive a degree of grafting.
The fraction of octyl groups is given by (i) half the ratio of the integral of the peaks of α-methylene at
3.0 ppm to the backbone methine integral and (ii) the third of the ratio of the integral of methyl protons at
0.85 ppm to the same methine integral. The two estimates thus obtained do not differ by more than 10%.
13 C NMR provides further estimates of the grafting ratios (Fig. 4.35). The two carbonyl peaks in
the 170–190 ppm region are due to the carboxylate and amide functions. The ratio of their integrals
Fig. 4.34
1
H NMR spectrum of A8-35 recorded in CD 3 OD.
Fig. 4.35
13
C NMR spectrum of A8-35 recorded in CD 3 OD.
4.5 Protocol 4.1: Synthesis of A8-35
209