

322
T. Ishimoto and M. Tachikawa
Table 17.4 The stable hydrogen-bonded structures of paraelectric and antiferroelectric phases of
mixed K 3 H 1−x D x (SO 4 ) 2
D concentration (x)
0.00
0.25
0.50
0.75
1.00
a (Paraelectric Phase)
Energy (kcal/mol)
0.00
0.00
0.00
0.00
0.00
Exponent
16.90 19.17 21.21 23.08 24.81
Electronic Population −0.598 −0.600 −0.601 −0.603 −0.604
O–H Distance (Å)
1.224 1.222 1.221 1.220 1.219
O· · ·O Distance (Å)
2.448 2.444 2.442 2.440 2.438
b (Antiferroelectric Phase) Energy (kcal/mol)
–
−0.01 −0.07 −0.12 −0.17
Exponent
–
19.85 22.21 24.32 26.12
Electronic Population –
−0.618 −0.624 −0.632 −0.633
O–H Distance (Å)
–
1.123 1.112 1.105 1.100
O· · ·O Distance (Å)
–
2.471 2.474 2.477 2.479
T c
–
7
25
59
85
Δα
–
0 .68
1.00
1.24
1.31
mixed K 3 H 1−x D x (SO 4 ) 2 and (H 1−x D x ) 2 SQ above. The mass of triton was treated
as 5492.57 a.u.
Before discussing the details of geometrical changes and T c of mixed K 3 H 1−x D x
(SO 4 ) 2 crystal, the important two geometries of KHS cluster have already reported
in the previous Sect. 17.3.1. In one structure (a) the proton/deuteron locates at the
center between two connected oxygen atoms. In the other structure (b) the proton/deuteron is located at one side of two oxygen atoms. These structures, (a) and
(b), correspond to the paraelectric and antiferroelectric phases, respectively. First the
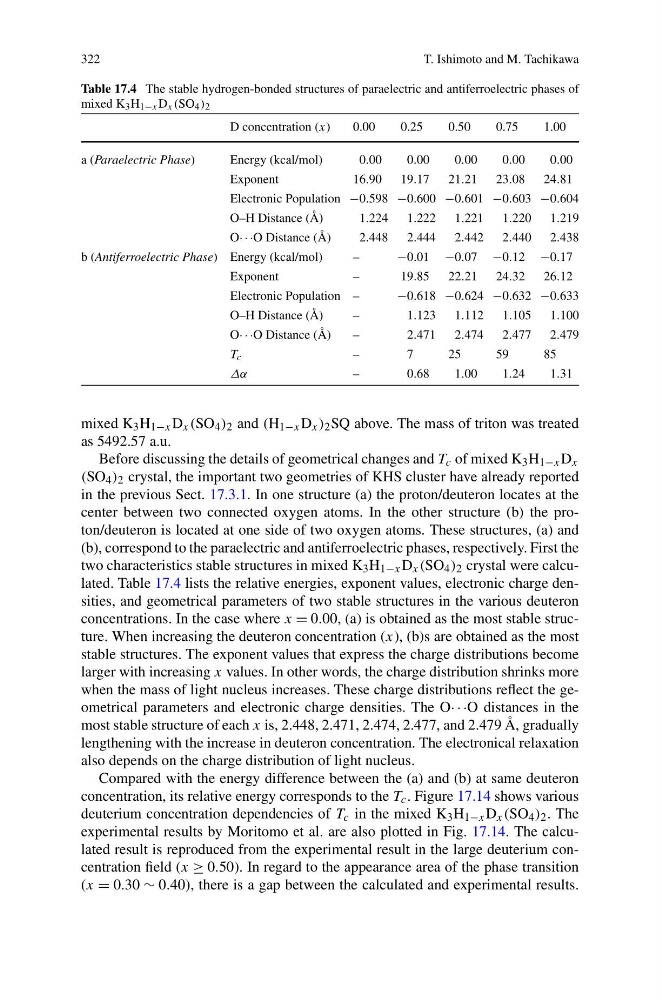
two characteristics stable structures in mixed K 3 H 1−x D x (SO 4 ) 2 crystal were calculated. Table 17.4 lists the relative energies, exponent values, electronic charge densities, and geometrical parameters of two stable structures in the various deuteron
concentrations. In the case where x = 0.00, (a) is obtained as the most stable structure. When increasing the deuteron concentration (x), (b)s are obtained as the most
stable structures. The exponent values that express the charge distributions become
larger with increasing x values. In other words, the charge distribution shrinks more
when the mass of light nucleus increases. These charge distributions reflect the geometrical parameters and electronic charge densities. The O· · ·O distances in the
most stable structure of each x is, 2.448, 2.471, 2.474, 2.477, and 2.479 Å, gradually
lengthening with the increase in deuteron concentration. The electronical relaxation
also depends on the charge distribution of light nucleus.
Compared with the energy difference between the (a) and (b) at same deuteron
concentration, its relative energy corresponds to the T c . Figure 17.14 shows various
deuterium concentration dependencies of T c in the mixed K 3 H 1−x D x (SO 4 ) 2 . The
experimental results by Moritomo et al. are also plotted in Fig. 17.14. The calculated result is reproduced from the experimental result in the large deuterium concentration field (x ≥ 0.50). In regard to the appearance area of the phase transition
(x = 0.30 ∼ 0.40), there is a gap between the calculated and experimental results.
T. Ishimoto and M. Tachikawa
Table 17.4 The stable hydrogen-bonded structures of paraelectric and antiferroelectric phases of
mixed K 3 H 1−x D x (SO 4 ) 2
D concentration (x)
0.00
0.25
0.50
0.75
1.00
a (Paraelectric Phase)
Energy (kcal/mol)
0.00
0.00
0.00
0.00
0.00
Exponent
16.90 19.17 21.21 23.08 24.81
Electronic Population −0.598 −0.600 −0.601 −0.603 −0.604
O–H Distance (Å)
1.224 1.222 1.221 1.220 1.219
O· · ·O Distance (Å)
2.448 2.444 2.442 2.440 2.438
b (Antiferroelectric Phase) Energy (kcal/mol)
–
−0.01 −0.07 −0.12 −0.17
Exponent
–
19.85 22.21 24.32 26.12
Electronic Population –
−0.618 −0.624 −0.632 −0.633
O–H Distance (Å)
–
1.123 1.112 1.105 1.100
O· · ·O Distance (Å)
–
2.471 2.474 2.477 2.479
T c
–
7
25
59
85
Δα
–
0 .68
1.00
1.24
1.31
mixed K 3 H 1−x D x (SO 4 ) 2 and (H 1−x D x ) 2 SQ above. The mass of triton was treated
as 5492.57 a.u.
Before discussing the details of geometrical changes and T c of mixed K 3 H 1−x D x
(SO 4 ) 2 crystal, the important two geometries of KHS cluster have already reported
in the previous Sect. 17.3.1. In one structure (a) the proton/deuteron locates at the
center between two connected oxygen atoms. In the other structure (b) the proton/deuteron is located at one side of two oxygen atoms. These structures, (a) and
(b), correspond to the paraelectric and antiferroelectric phases, respectively. First the
two characteristics stable structures in mixed K 3 H 1−x D x (SO 4 ) 2 crystal were calculated. Table 17.4 lists the relative energies, exponent values, electronic charge densities, and geometrical parameters of two stable structures in the various deuteron
concentrations. In the case where x = 0.00, (a) is obtained as the most stable structure. When increasing the deuteron concentration (x), (b)s are obtained as the most
stable structures. The exponent values that express the charge distributions become
larger with increasing x values. In other words, the charge distribution shrinks more
when the mass of light nucleus increases. These charge distributions reflect the geometrical parameters and electronic charge densities. The O· · ·O distances in the
most stable structure of each x is, 2.448, 2.471, 2.474, 2.477, and 2.479 Å, gradually
lengthening with the increase in deuteron concentration. The electronical relaxation
also depends on the charge distribution of light nucleus.
Compared with the energy difference between the (a) and (b) at same deuteron
concentration, its relative energy corresponds to the T c . Figure 17.14 shows various
deuterium concentration dependencies of T c in the mixed K 3 H 1−x D x (SO 4 ) 2 . The
experimental results by Moritomo et al. are also plotted in Fig. 17.14. The calculated result is reproduced from the experimental result in the large deuterium concentration field (x ≥ 0.50). In regard to the appearance area of the phase transition
(x = 0.30 ∼ 0.40), there is a gap between the calculated and experimental results.