

268
E.F. Sheka
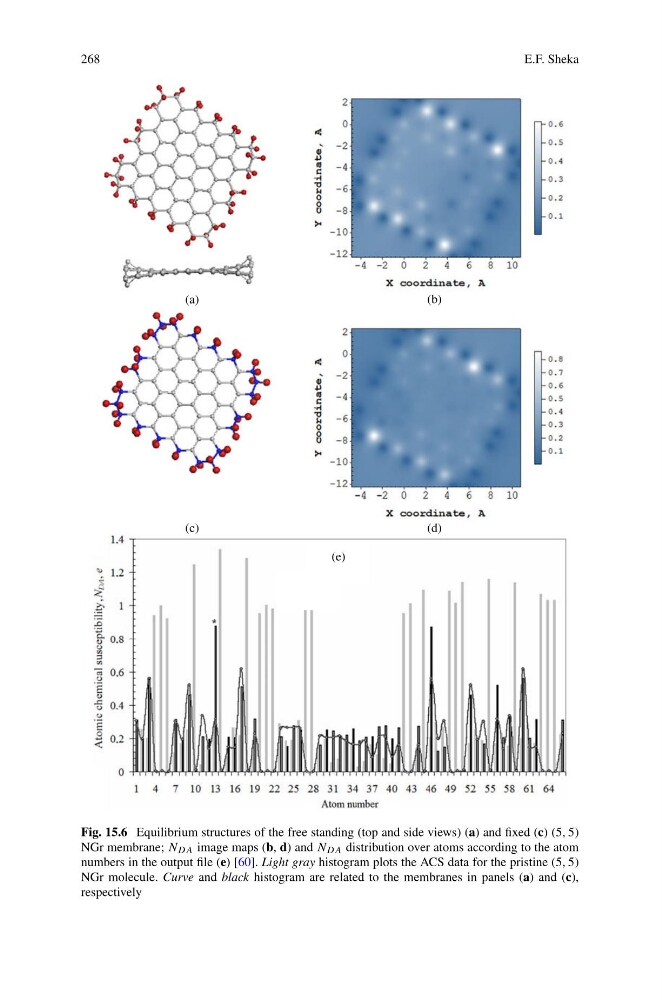
Fig. 15.6 Equilibrium structures of the free standing (top and side views) (a) and fixed (c) (5, 5)
NGr membrane; N DA image maps (b, d) and N DA distribution over atoms according to the atom
numbers in the output file (e) [60]. Light gray histogram plots the ACS data for the pristine (5, 5)
NGr molecule. Curve and black histogram are related to the membranes in panels (a) and (c),
respectively
E.F. Sheka
Fig. 15.6 Equilibrium structures of the free standing (top and side views) (a) and fixed (c) (5, 5)
NGr membrane; N DA image maps (b, d) and N DA distribution over atoms according to the atom
numbers in the output file (e) [60]. Light gray histogram plots the ACS data for the pristine (5, 5)
NGr molecule. Curve and black histogram are related to the membranes in panels (a) and (c),
respectively