

266
E.F. Sheka
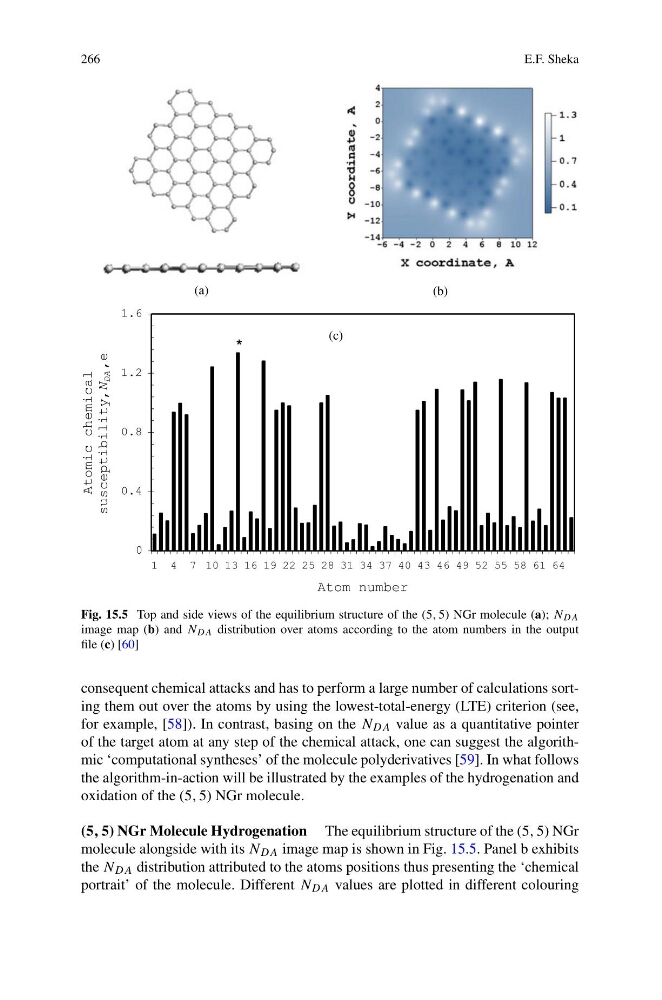
Fig. 15.5 Top and side views of the equilibrium structure of the (5, 5) NGr molecule (a); N DA
image map (b) and N DA distribution over atoms according to the atom numbers in the output
file (c) [60]
consequent chemical attacks and has to perform a large number of calculations sorting them out over the atoms by using the lowest-total-energy (LTE) criterion (see,
for example, [58]). In contrast, basing on the N DA value as a quantitative pointer
of the target atom at any step of the chemical attack, one can suggest the algorithmic ‘computational syntheses’ of the molecule polyderivatives [59]. In what follows
the algorithm-in-action will be illustrated by the examples of the hydrogenation and
oxidation of the (5, 5) NGr molecule.
(5, 5) NGr Molecule Hydrogenation The equilibrium structure of the (5, 5) NGr
molecule alongside with its N DA image map is shown in Fig. 15.5. Panel b exhibits
the N DA distribution attributed to the atoms positions thus presenting the ‘chemical
portrait’ of the molecule. Different N DA values are plotted in different colouring
E.F. Sheka
Fig. 15.5 Top and side views of the equilibrium structure of the (5, 5) NGr molecule (a); N DA
image map (b) and N DA distribution over atoms according to the atom numbers in the output
file (c) [60]
consequent chemical attacks and has to perform a large number of calculations sorting them out over the atoms by using the lowest-total-energy (LTE) criterion (see,
for example, [58]). In contrast, basing on the N DA value as a quantitative pointer
of the target atom at any step of the chemical attack, one can suggest the algorithmic ‘computational syntheses’ of the molecule polyderivatives [59]. In what follows
the algorithm-in-action will be illustrated by the examples of the hydrogenation and
oxidation of the (5, 5) NGr molecule.
(5, 5) NGr Molecule Hydrogenation The equilibrium structure of the (5, 5) NGr
molecule alongside with its N DA image map is shown in Fig. 15.5. Panel b exhibits
the N DA distribution attributed to the atoms positions thus presenting the ‘chemical
portrait’ of the molecule. Different N DA values are plotted in different colouring