

240
T. Onishi and T. Helgaker
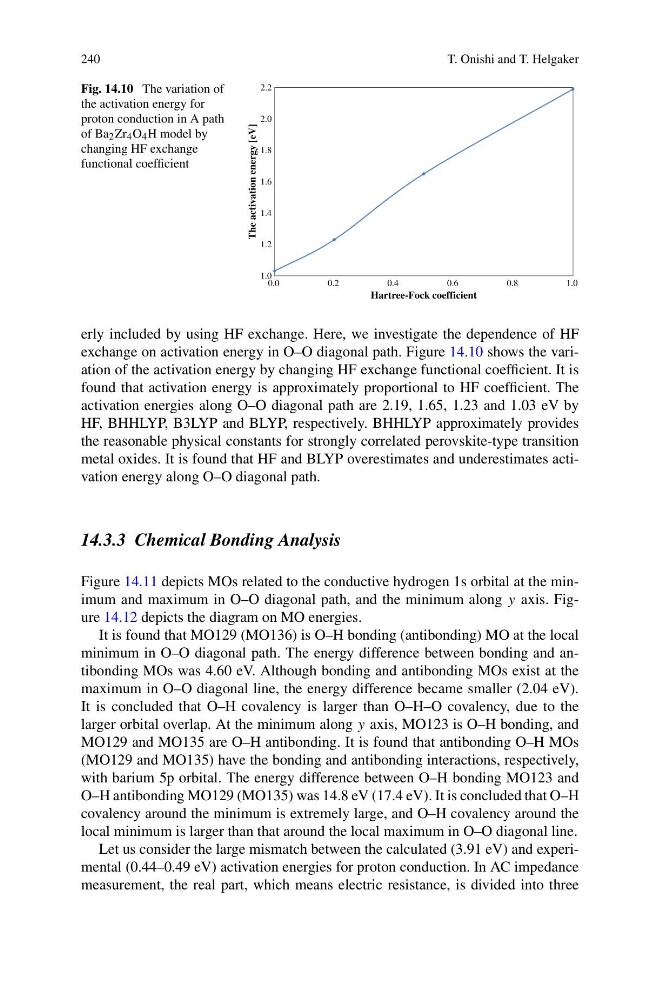
Fig. 14.10 The variation of
the activation energy for
proton conduction in A path
of Ba 2 Zr 4 O 4 H model by
changing HF exchange
functional coefficient
erly included by using HF exchange. Here, we investigate the dependence of HF
exchange on activation energy in O–O diagonal path. Figure 14.10 shows the variation of the activation energy by changing HF exchange functional coefficient. It is
found that activation energy is approximately proportional to HF coefficient. The
activation energies along O–O diagonal path are 2.19, 1.65, 1.23 and 1.03 eV by
HF, BHHLYP, B3LYP and BLYP, respectively. BHHLYP approximately provides
the reasonable physical constants for strongly correlated perovskite-type transition
metal oxides. It is found that HF and BLYP overestimates and underestimates activation energy along O–O diagonal path.
14.3.3 Chemical Bonding Analysis
Figure 14.11 depicts MOs related to the conductive hydrogen 1s orbital at the minimum and maximum in O–O diagonal path, and the minimum along y axis. Figure 14.12 depicts the diagram on MO energies.
It is found that MO129 (MO136) is O–H bonding (antibonding) MO at the local
minimum in O–O diagonal path. The energy difference between bonding and antibonding MOs was 4.60 eV. Although bonding and antibonding MOs exist at the
maximum in O–O diagonal line, the energy difference became smaller (2.04 eV).
It is concluded that O–H covalency is larger than O–H–O covalency, due to the
larger orbital overlap. At the minimum along y axis, MO123 is O–H bonding, and
MO129 and MO135 are O–H antibonding. It is found that antibonding O–H MOs
(MO129 and MO135) have the bonding and antibonding interactions, respectively,
with barium 5p orbital. The energy difference between O–H bonding MO123 and
O–H antibonding MO129 (MO135) was 14.8 eV (17.4 eV). It is concluded that O–H
covalency around the minimum is extremely large, and O–H covalency around the
local minimum is larger than that around the local maximum in O–O diagonal line.
Let us consider the large mismatch between the calculated (3.91 eV) and experimental (0.44–0.49 eV) activation energies for proton conduction. In AC impedance
measurement, the real part, which means electric resistance, is divided into three
T. Onishi and T. Helgaker
Fig. 14.10 The variation of
the activation energy for
proton conduction in A path
of Ba 2 Zr 4 O 4 H model by
changing HF exchange
functional coefficient
erly included by using HF exchange. Here, we investigate the dependence of HF
exchange on activation energy in O–O diagonal path. Figure 14.10 shows the variation of the activation energy by changing HF exchange functional coefficient. It is
found that activation energy is approximately proportional to HF coefficient. The
activation energies along O–O diagonal path are 2.19, 1.65, 1.23 and 1.03 eV by
HF, BHHLYP, B3LYP and BLYP, respectively. BHHLYP approximately provides
the reasonable physical constants for strongly correlated perovskite-type transition
metal oxides. It is found that HF and BLYP overestimates and underestimates activation energy along O–O diagonal path.
14.3.3 Chemical Bonding Analysis
Figure 14.11 depicts MOs related to the conductive hydrogen 1s orbital at the minimum and maximum in O–O diagonal path, and the minimum along y axis. Figure 14.12 depicts the diagram on MO energies.
It is found that MO129 (MO136) is O–H bonding (antibonding) MO at the local
minimum in O–O diagonal path. The energy difference between bonding and antibonding MOs was 4.60 eV. Although bonding and antibonding MOs exist at the
maximum in O–O diagonal line, the energy difference became smaller (2.04 eV).
It is concluded that O–H covalency is larger than O–H–O covalency, due to the
larger orbital overlap. At the minimum along y axis, MO123 is O–H bonding, and
MO129 and MO135 are O–H antibonding. It is found that antibonding O–H MOs
(MO129 and MO135) have the bonding and antibonding interactions, respectively,
with barium 5p orbital. The energy difference between O–H bonding MO123 and
O–H antibonding MO129 (MO135) was 14.8 eV (17.4 eV). It is concluded that O–H
covalency around the minimum is extremely large, and O–H covalency around the
local minimum is larger than that around the local maximum in O–O diagonal line.
Let us consider the large mismatch between the calculated (3.91 eV) and experimental (0.44–0.49 eV) activation energies for proton conduction. In AC impedance
measurement, the real part, which means electric resistance, is divided into three