

3.3.2 Effect of Ethylene Concentration
With in situ macromer incorporation as the LCB mechanism, the LCB content
should change when the ratio [ethylene]/[vinyl terminated polyethylene chain]
changes.
Figure 6 shows the η* versus ω curves for polyethylenes produced at different
ethylene concentrations (C E ) in a semi-batch slurry polymerization. Samples produced with lower C E exhibit increasingly high values of low shear rate viscosity
versus the SEC-measured M W , and more pronounced shear thinning [46].
Interestingly, for the polymers produced with 1/MAO, 3/MAO, and 6/MAO,
a clear deviation from linearity is seen only at the lowest C E . At high ethylene
concentration, the difference between expected η 0 and measured η*(ω ¼ 0.02 rad s
À1
)
values became smaller and the flow activation energy E a values of these polymers
were comparable to the values expected for linear polyethylenes [46, 51].
In addition to the semi-batch slurry experiments, 9/MAO was used in solution in
a continuous stirred tank reactor (CSTR) to further investigate the influence of
[ethylene]/[macromonomer] ratio on LCB. Figure 7 shows a quantitative analysis
of the
13 C-NMR-based LCB content in polyethylene as a function of the [ethylene]/
[macromonomer] ratio [85]. The LCB content was the highest at low ratios and
rapidly decreased with an increase in the [ethylene]/[macromonomer] ratio. This is
in line with LCB formation via the copolymerization reaction.
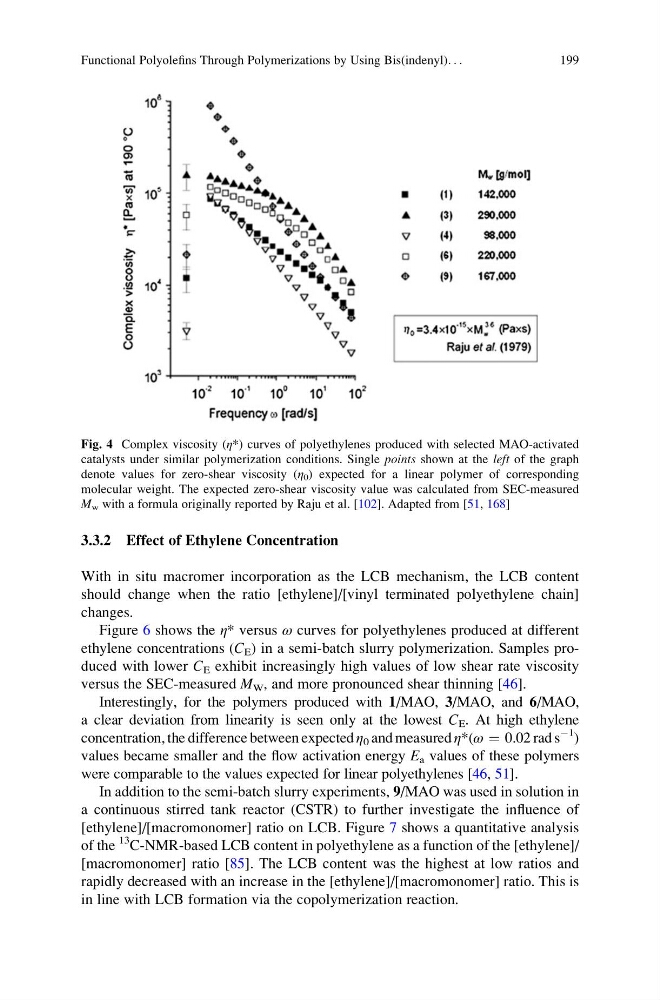
Fig. 4 Complex viscosity (η*) curves of polyethylenes produced with selected MAO-activated
catalysts under similar polymerization conditions. Single points shown at the left of the graph
denote values for zero-shear viscosity (η 0 ) expected for a linear polymer of corresponding
molecular weight. The expected zero-shear viscosity value was calculated from SEC-measured
M w with a formula originally reported by Raju et al. [102]. Adapted from [51, 168]
Functional Polyolefins Through Polymerizations by Using Bis(indenyl). . .
199
With in situ macromer incorporation as the LCB mechanism, the LCB content
should change when the ratio [ethylene]/[vinyl terminated polyethylene chain]
changes.
Figure 6 shows the η* versus ω curves for polyethylenes produced at different
ethylene concentrations (C E ) in a semi-batch slurry polymerization. Samples produced with lower C E exhibit increasingly high values of low shear rate viscosity
versus the SEC-measured M W , and more pronounced shear thinning [46].
Interestingly, for the polymers produced with 1/MAO, 3/MAO, and 6/MAO,
a clear deviation from linearity is seen only at the lowest C E . At high ethylene
concentration, the difference between expected η 0 and measured η*(ω ¼ 0.02 rad s
À1
)
values became smaller and the flow activation energy E a values of these polymers
were comparable to the values expected for linear polyethylenes [46, 51].
In addition to the semi-batch slurry experiments, 9/MAO was used in solution in
a continuous stirred tank reactor (CSTR) to further investigate the influence of
[ethylene]/[macromonomer] ratio on LCB. Figure 7 shows a quantitative analysis
of the
13 C-NMR-based LCB content in polyethylene as a function of the [ethylene]/
[macromonomer] ratio [85]. The LCB content was the highest at low ratios and
rapidly decreased with an increase in the [ethylene]/[macromonomer] ratio. This is
in line with LCB formation via the copolymerization reaction.
Fig. 4 Complex viscosity (η*) curves of polyethylenes produced with selected MAO-activated
catalysts under similar polymerization conditions. Single points shown at the left of the graph
denote values for zero-shear viscosity (η 0 ) expected for a linear polymer of corresponding
molecular weight. The expected zero-shear viscosity value was calculated from SEC-measured
M w with a formula originally reported by Raju et al. [102]. Adapted from [51, 168]
Functional Polyolefins Through Polymerizations by Using Bis(indenyl). . .
199