

Although this work had shown that QD oligomers could be substantially
enriched by ultracentrifugation, their purity still was not 100%. Another way to
achieve 100% purity – at least in spectroscopic investigations – was to study single
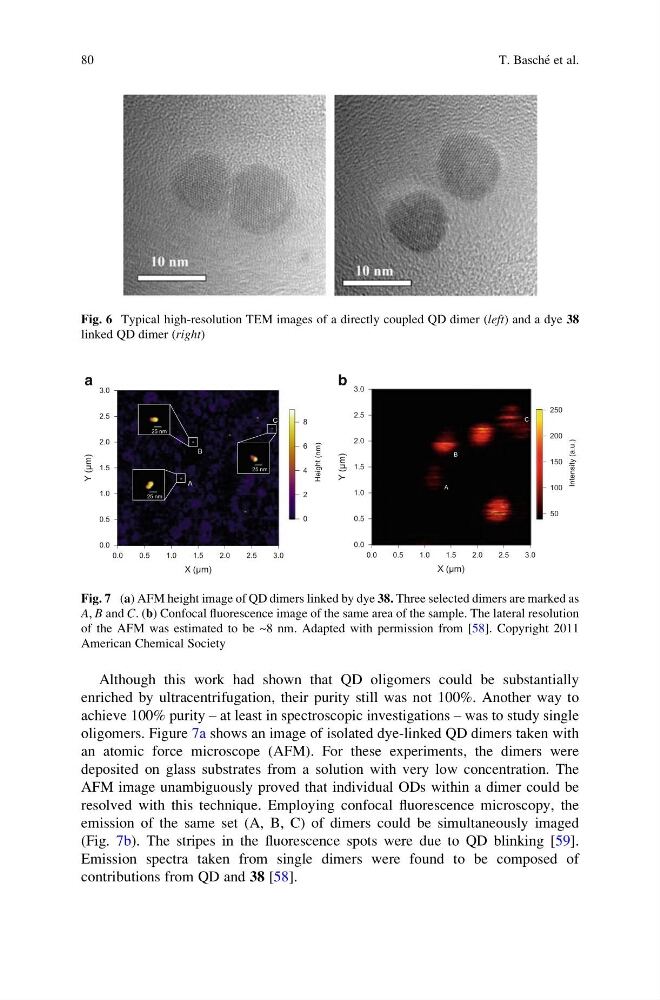
oligomers. Figure 7a shows an image of isolated dye-linked QD dimers taken with
an atomic force microscope (AFM). For these experiments, the dimers were
deposited on glass substrates from a solution with very low concentration. The
AFM image unambiguously proved that individual ODs within a dimer could be
resolved with this technique. Employing confocal fluorescence microscopy, the
emission of the same set (A, B, C) of dimers could be simultaneously imaged
(Fig. 7b). The stripes in the fluorescence spots were due to QD blinking [59].
Emission spectra taken from single dimers were found to be composed of
contributions from QD and 38 [58].
Fig. 6 Typical high-resolution TEM images of a directly coupled QD dimer (left) and a dye 38
linked QD dimer (right)
3.0
2.5
2.0
1.5
1.0
0.5
0.0
Y (µm)
3.0
2.5
2.0
1.5
1.0
0.5
0.0
X (µm)
25 nm
25 nm
25 nm
C
B
A
8
6
4
2
0
Height (nm)
3.0
2.5
2.0
1.5
1.0
0.5
0.0
Y (µm)
3.0
2.5
2.0
1.5
1.0
0.5
0.0
X (µm)
C
B
A
250
200
150
100
50
Intensity (a.u.)
a
b
Fig. 7 (a) AFM height image of QD dimers linked by dye 38. Three selected dimers are marked as
A, B and C. (b) Confocal fluorescence image of the same area of the sample. The lateral resolution
of the AFM was estimated to be ~8 nm. Adapted with permission from [58]. Copyright 2011
American Chemical Society
80
T. Basche ´ et al.
enriched by ultracentrifugation, their purity still was not 100%. Another way to
achieve 100% purity – at least in spectroscopic investigations – was to study single
oligomers. Figure 7a shows an image of isolated dye-linked QD dimers taken with
an atomic force microscope (AFM). For these experiments, the dimers were
deposited on glass substrates from a solution with very low concentration. The
AFM image unambiguously proved that individual ODs within a dimer could be
resolved with this technique. Employing confocal fluorescence microscopy, the
emission of the same set (A, B, C) of dimers could be simultaneously imaged
(Fig. 7b). The stripes in the fluorescence spots were due to QD blinking [59].
Emission spectra taken from single dimers were found to be composed of
contributions from QD and 38 [58].
Fig. 6 Typical high-resolution TEM images of a directly coupled QD dimer (left) and a dye 38
linked QD dimer (right)
3.0
2.5
2.0
1.5
1.0
0.5
0.0
Y (µm)
3.0
2.5
2.0
1.5
1.0
0.5
0.0
X (µm)
25 nm
25 nm
25 nm
C
B
A
8
6
4
2
0
Height (nm)
3.0
2.5
2.0
1.5
1.0
0.5
0.0
Y (µm)
3.0
2.5
2.0
1.5
1.0
0.5
0.0
X (µm)
C
B
A
250
200
150
100
50
Intensity (a.u.)
a
b
Fig. 7 (a) AFM height image of QD dimers linked by dye 38. Three selected dimers are marked as
A, B and C. (b) Confocal fluorescence image of the same area of the sample. The lateral resolution
of the AFM was estimated to be ~8 nm. Adapted with permission from [58]. Copyright 2011
American Chemical Society
80
T. Basche ´ et al.