

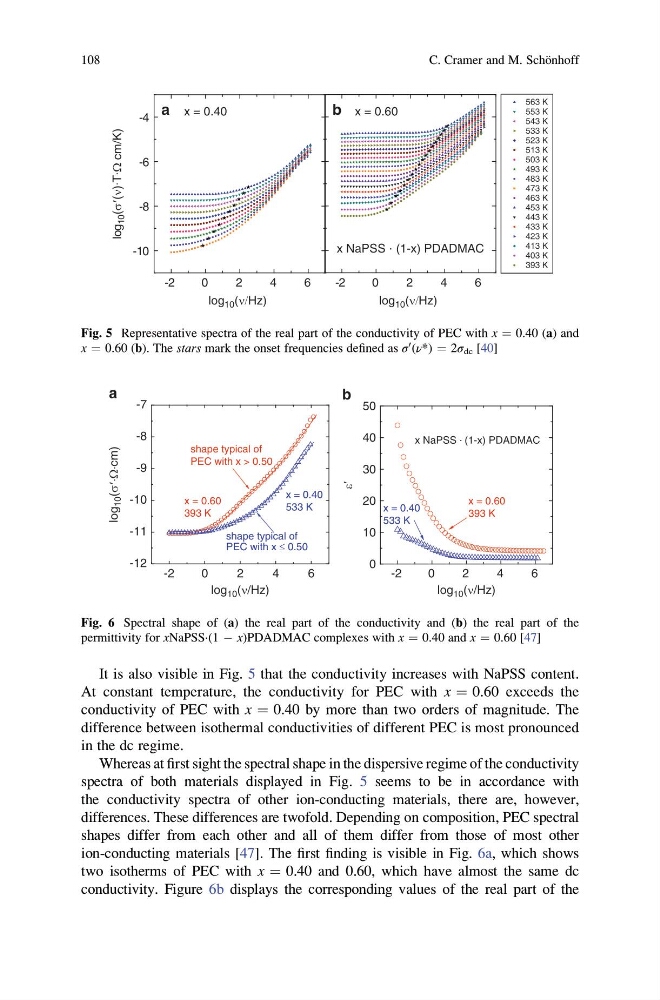
It is also visible in Fig. 5 that the conductivity increases with NaPSS content.
At constant temperature, the conductivity for PEC with x ¼ 0.60 exceeds the
conductivity of PEC with x ¼ 0.40 by more than two orders of magnitude. The
difference between isothermal conductivities of different PEC is most pronounced
in the dc regime.
Whereas at first sight the spectral shape in the dispersive regime of the conductivity
spectra of both materials displayed in Fig. 5 seems to be in accordance with
the conductivity spectra of other ion-conducting materials, there are, however,
differences. These differences are twofold. Depending on composition, PEC spectral
shapes differ from each other and all of them differ from those of most other
ion-conducting materials [47]. The first finding is visible in Fig. 6a, which shows
two isotherms of PEC with x ¼ 0.40 and 0.60, which have almost the same dc
conductivity. Figure 6b displays the corresponding values of the real part of the
-2
0
2
4
6
x NaPSS ⋅ (1-x) PDADMAC
563 K
553 K
543 K
533 K
523 K
513 K
503 K
493 K
483 K
473 K
463 K
453 K
443 K
433 K
423 K
413 K
403 K
393 K
b x = 0.60
-2
0
2
4
6
-10
-8
-6
-4
a x = 0.40
log
10 (σ¢(ν) .
T .
W cm/K)
log 10 (ν/Hz)
log 10 (ν/Hz)
Fig. 5 Representative spectra of the real part of the conductivity of PEC with x ¼ 0.40 (a) and
x ¼ 0.60 (b). The stars mark the onset frequencies defined as σ
0 (ν*) ¼ 2σ dc [40]
-2
0
2
4
6
0
10
20
30
40
50
x NaPSS . (1-x) PDADMAC
x = 0.40
533 K
x = 0.60
393 K
b
-2
0
2
4
6
-12
-11
-10
-9
-8
-7
shape typical of
PEC with x > 0.50
shape typical of
PEC with x £ 0.50
x = 0.40
533 K
x = 0.60
393 K
a
log
10 (s¢×W×cm)
e¢
log 10 (n/Hz)
log 10 (n/Hz)
Fig. 6 Spectral shape of (a) the real part of the conductivity and (b) the real part of the
permittivity for xNaPSS·(1 À x)PDADMAC complexes with x ¼ 0.40 and x ¼ 0.60 [47]
108
C. Cramer and M. Scho ¨nhoff
At constant temperature, the conductivity for PEC with x ¼ 0.60 exceeds the
conductivity of PEC with x ¼ 0.40 by more than two orders of magnitude. The
difference between isothermal conductivities of different PEC is most pronounced
in the dc regime.
Whereas at first sight the spectral shape in the dispersive regime of the conductivity
spectra of both materials displayed in Fig. 5 seems to be in accordance with
the conductivity spectra of other ion-conducting materials, there are, however,
differences. These differences are twofold. Depending on composition, PEC spectral
shapes differ from each other and all of them differ from those of most other
ion-conducting materials [47]. The first finding is visible in Fig. 6a, which shows
two isotherms of PEC with x ¼ 0.40 and 0.60, which have almost the same dc
conductivity. Figure 6b displays the corresponding values of the real part of the
-2
0
2
4
6
x NaPSS ⋅ (1-x) PDADMAC
563 K
553 K
543 K
533 K
523 K
513 K
503 K
493 K
483 K
473 K
463 K
453 K
443 K
433 K
423 K
413 K
403 K
393 K
b x = 0.60
-2
0
2
4
6
-10
-8
-6
-4
a x = 0.40
log
10 (σ¢(ν) .
T .
W cm/K)
log 10 (ν/Hz)
log 10 (ν/Hz)
Fig. 5 Representative spectra of the real part of the conductivity of PEC with x ¼ 0.40 (a) and
x ¼ 0.60 (b). The stars mark the onset frequencies defined as σ
0 (ν*) ¼ 2σ dc [40]
-2
0
2
4
6
0
10
20
30
40
50
x NaPSS . (1-x) PDADMAC
x = 0.40
533 K
x = 0.60
393 K
b
-2
0
2
4
6
-12
-11
-10
-9
-8
-7
shape typical of
PEC with x > 0.50
shape typical of
PEC with x £ 0.50
x = 0.40
533 K
x = 0.60
393 K
a
log
10 (s¢×W×cm)
e¢
log 10 (n/Hz)
log 10 (n/Hz)
Fig. 6 Spectral shape of (a) the real part of the conductivity and (b) the real part of the
permittivity for xNaPSS·(1 À x)PDADMAC complexes with x ¼ 0.40 and x ¼ 0.60 [47]
108
C. Cramer and M. Scho ¨nhoff