

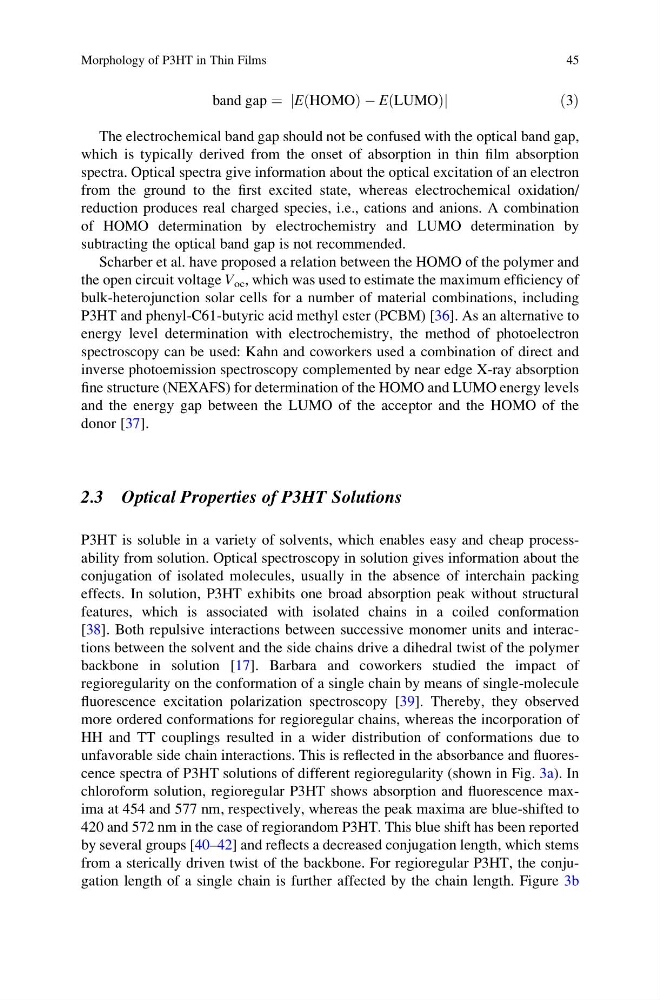
band gap ¼ E HOMO
ð
ÞÀE LUMO
ð
Þ
j
j
ð3Þ
The electrochemical band gap should not be confused with the optical band gap,
which is typically derived from the onset of absorption in thin film absorption
spectra. Optical spectra give information about the optical excitation of an electron
from the ground to the first excited state, whereas electrochemical oxidation/
reduction produces real charged species, i.e., cations and anions. A combination
of HOMO determination by electrochemistry and LUMO determination by
subtracting the optical band gap is not recommended.
Scharber et al. have proposed a relation between the HOMO of the polymer and
the open circuit voltage V oc , which was used to estimate the maximum efficiency of
bulk-heterojunction solar cells for a number of material combinations, including
P3HT and phenyl-C61-butyric acid methyl ester (PCBM) [36]. As an alternative to
energy level determination with electrochemistry, the method of photoelectron
spectroscopy can be used: Kahn and coworkers used a combination of direct and
inverse photoemission spectroscopy complemented by near edge X-ray absorption
fine structure (NEXAFS) for determination of the HOMO and LUMO energy levels
and the energy gap between the LUMO of the acceptor and the HOMO of the
donor [37].
2.3 Optical Properties of P3HT Solutions
P3HT is soluble in a variety of solvents, which enables easy and cheap processability from solution. Optical spectroscopy in solution gives information about the
conjugation of isolated molecules, usually in the absence of interchain packing
effects. In solution, P3HT exhibits one broad absorption peak without structural
features, which is associated with isolated chains in a coiled conformation
[38]. Both repulsive interactions between successive monomer units and interactions between the solvent and the side chains drive a dihedral twist of the polymer
backbone in solution [17]. Barbara and coworkers studied the impact of
regioregularity on the conformation of a single chain by means of single-molecule
fluorescence excitation polarization spectroscopy [39]. Thereby, they observed
more ordered conformations for regioregular chains, whereas the incorporation of
HH and TT couplings resulted in a wider distribution of conformations due to
unfavorable side chain interactions. This is reflected in the absorbance and fluorescence spectra of P3HT solutions of different regioregularity (shown in Fig. 3a). In
chloroform solution, regioregular P3HT shows absorption and fluorescence maxima at 454 and 577 nm, respectively, whereas the peak maxima are blue-shifted to
420 and 572 nm in the case of regiorandom P3HT. This blue shift has been reported
by several groups [40–42] and reflects a decreased conjugation length, which stems
from a sterically driven twist of the backbone. For regioregular P3HT, the conjugation length of a single chain is further affected by the chain length. Figure 3b
Morphology of P3HT in Thin Films
45
ð
ÞÀE LUMO
ð
Þ
j
j
ð3Þ
The electrochemical band gap should not be confused with the optical band gap,
which is typically derived from the onset of absorption in thin film absorption
spectra. Optical spectra give information about the optical excitation of an electron
from the ground to the first excited state, whereas electrochemical oxidation/
reduction produces real charged species, i.e., cations and anions. A combination
of HOMO determination by electrochemistry and LUMO determination by
subtracting the optical band gap is not recommended.
Scharber et al. have proposed a relation between the HOMO of the polymer and
the open circuit voltage V oc , which was used to estimate the maximum efficiency of
bulk-heterojunction solar cells for a number of material combinations, including
P3HT and phenyl-C61-butyric acid methyl ester (PCBM) [36]. As an alternative to
energy level determination with electrochemistry, the method of photoelectron
spectroscopy can be used: Kahn and coworkers used a combination of direct and
inverse photoemission spectroscopy complemented by near edge X-ray absorption
fine structure (NEXAFS) for determination of the HOMO and LUMO energy levels
and the energy gap between the LUMO of the acceptor and the HOMO of the
donor [37].
2.3 Optical Properties of P3HT Solutions
P3HT is soluble in a variety of solvents, which enables easy and cheap processability from solution. Optical spectroscopy in solution gives information about the
conjugation of isolated molecules, usually in the absence of interchain packing
effects. In solution, P3HT exhibits one broad absorption peak without structural
features, which is associated with isolated chains in a coiled conformation
[38]. Both repulsive interactions between successive monomer units and interactions between the solvent and the side chains drive a dihedral twist of the polymer
backbone in solution [17]. Barbara and coworkers studied the impact of
regioregularity on the conformation of a single chain by means of single-molecule
fluorescence excitation polarization spectroscopy [39]. Thereby, they observed
more ordered conformations for regioregular chains, whereas the incorporation of
HH and TT couplings resulted in a wider distribution of conformations due to
unfavorable side chain interactions. This is reflected in the absorbance and fluorescence spectra of P3HT solutions of different regioregularity (shown in Fig. 3a). In
chloroform solution, regioregular P3HT shows absorption and fluorescence maxima at 454 and 577 nm, respectively, whereas the peak maxima are blue-shifted to
420 and 572 nm in the case of regiorandom P3HT. This blue shift has been reported
by several groups [40–42] and reflects a decreased conjugation length, which stems
from a sterically driven twist of the backbone. For regioregular P3HT, the conjugation length of a single chain is further affected by the chain length. Figure 3b
Morphology of P3HT in Thin Films
45