

seen from the table. The model equally applies when no filler is added, suggesting
that part of the entanglement network has a longer relaxation time than the
experimental time defined as the inverse of the frequency.
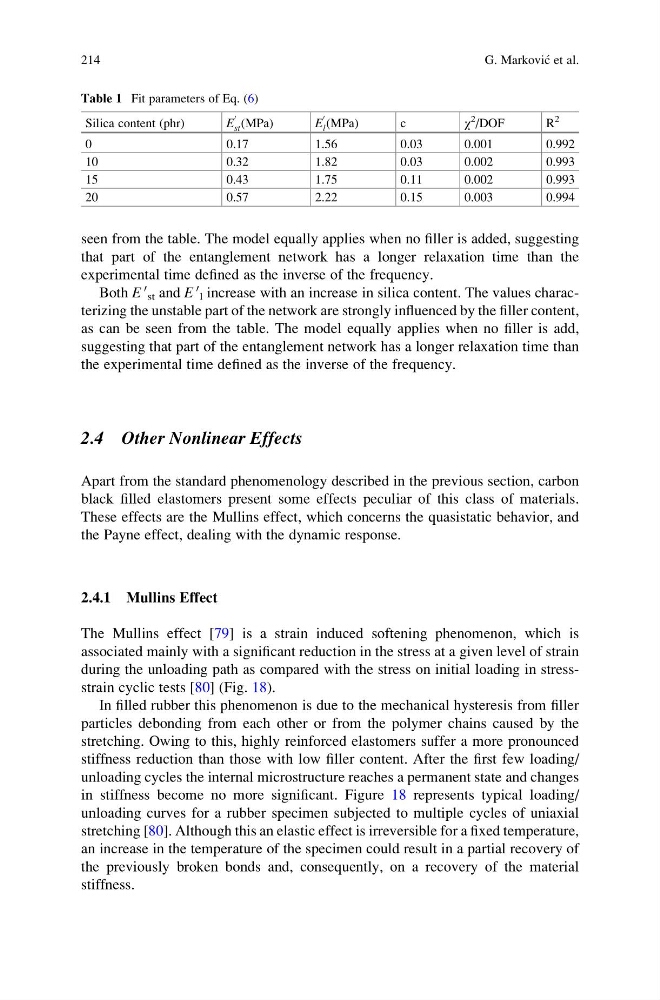
Both E
0
st and E
0
l increase with an increase in silica content. The values characterizing the unstable part of the network are strongly influenced by the filler content,
as can be seen from the table. The model equally applies when no filler is add,
suggesting that part of the entanglement network has a longer relaxation time than
the experimental time defined as the inverse of the frequency.
2.4 Other Nonlinear Effects
Apart from the standard phenomenology described in the previous section, carbon
black filled elastomers present some effects peculiar of this class of materials.
These effects are the Mullins effect, which concerns the quasistatic behavior, and
the Payne effect, dealing with the dynamic response.
2.4.1 Mullins Effect
The Mullins effect [79] is a strain induced softening phenomenon, which is
associated mainly with a significant reduction in the stress at a given level of strain
during the unloading path as compared with the stress on initial loading in stressstrain cyclic tests [80] (Fig. 18).
In filled rubber this phenomenon is due to the mechanical hysteresis from filler
particles debonding from each other or from the polymer chains caused by the
stretching. Owing to this, highly reinforced elastomers suffer a more pronounced
stiffness reduction than those with low filler content. After the first few loading/
unloading cycles the internal microstructure reaches a permanent state and changes
in stiffness become no more significant. Figure 18 represents typical loading/
unloading curves for a rubber specimen subjected to multiple cycles of uniaxial
stretching [80]. Although this an elastic effect is irreversible for a fixed temperature,
an increase in the temperature of the specimen could result in a partial recovery of
the previously broken bonds and, consequently, on a recovery of the material
stiffness.
Table 1 Fit parameters of Eq. (6)
Silica content (phr)
E
0
st (MPa)
E
0
l (MPa)
c
χ
2
/DOF
R
2
0
0.17
1.56
0.03
0.001
0.992
10
0.32
1.82
0.03
0.002
0.993
15
0.43
1.75
0.11
0.002
0.993
20
0.57
2.22
0.15
0.003
0.994
214
G. Markovic ´ et al.
that part of the entanglement network has a longer relaxation time than the
experimental time defined as the inverse of the frequency.
Both E
0
st and E
0
l increase with an increase in silica content. The values characterizing the unstable part of the network are strongly influenced by the filler content,
as can be seen from the table. The model equally applies when no filler is add,
suggesting that part of the entanglement network has a longer relaxation time than
the experimental time defined as the inverse of the frequency.
2.4 Other Nonlinear Effects
Apart from the standard phenomenology described in the previous section, carbon
black filled elastomers present some effects peculiar of this class of materials.
These effects are the Mullins effect, which concerns the quasistatic behavior, and
the Payne effect, dealing with the dynamic response.
2.4.1 Mullins Effect
The Mullins effect [79] is a strain induced softening phenomenon, which is
associated mainly with a significant reduction in the stress at a given level of strain
during the unloading path as compared with the stress on initial loading in stressstrain cyclic tests [80] (Fig. 18).
In filled rubber this phenomenon is due to the mechanical hysteresis from filler
particles debonding from each other or from the polymer chains caused by the
stretching. Owing to this, highly reinforced elastomers suffer a more pronounced
stiffness reduction than those with low filler content. After the first few loading/
unloading cycles the internal microstructure reaches a permanent state and changes
in stiffness become no more significant. Figure 18 represents typical loading/
unloading curves for a rubber specimen subjected to multiple cycles of uniaxial
stretching [80]. Although this an elastic effect is irreversible for a fixed temperature,
an increase in the temperature of the specimen could result in a partial recovery of
the previously broken bonds and, consequently, on a recovery of the material
stiffness.
Table 1 Fit parameters of Eq. (6)
Silica content (phr)
E
0
st (MPa)
E
0
l (MPa)
c
χ
2
/DOF
R
2
0
0.17
1.56
0.03
0.001
0.992
10
0.32
1.82
0.03
0.002
0.993
15
0.43
1.75
0.11
0.002
0.993
20
0.57
2.22
0.15
0.003
0.994
214
G. Markovic ´ et al.