

Carbon Footprint Estimation for Academic Building in India
57
2540
2560
2580
2600
2620
2640
2660
2680
2700
2720
2740
2007
2008
2009
2010
2011
2012
2013
2014
2015
2016
MtCO2e
Year
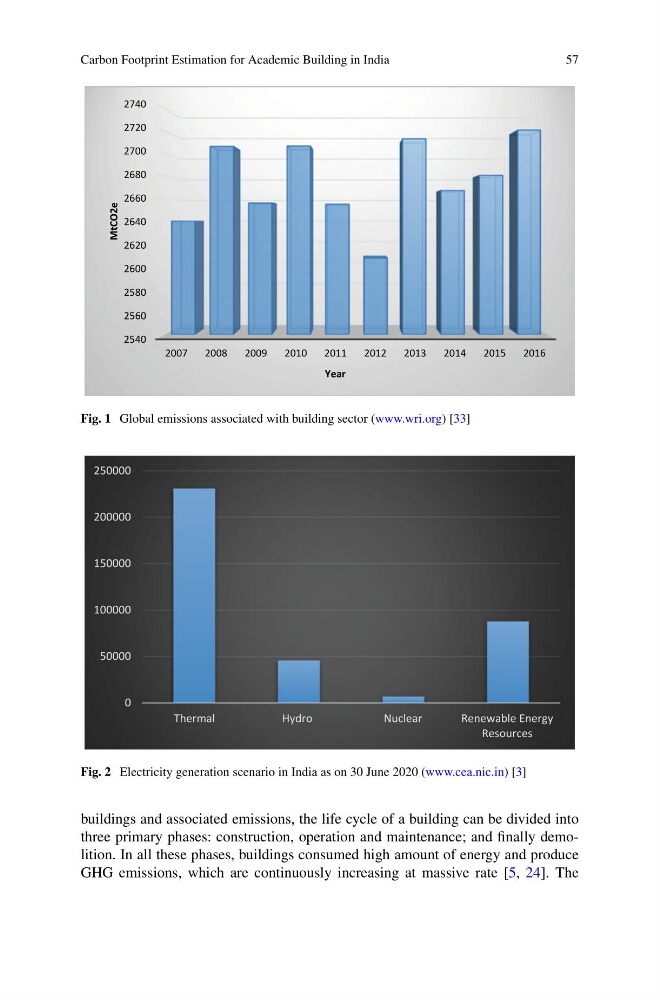
Fig. 1 Global emissions associated with building sector (www.wri.org) [33]
0
50000
100000
150000
200000
250000
Thermal
Hydro
Nuclear
Renewable Energy
Resources
Fig. 2 Electricity generation scenario in India as on 30 June 2020 (www.cea.nic.in) [3]
buildings and associated emissions, the life cycle of a building can be divided into
three primary phases: construction, operation and maintenance; and finally demolition. In all these phases, buildings consumed high amount of energy and produce
GHG emissions, which are continuously increasing at massive rate [5, 24]. The
57
2540
2560
2580
2600
2620
2640
2660
2680
2700
2720
2740
2007
2008
2009
2010
2011
2012
2013
2014
2015
2016
MtCO2e
Year
Fig. 1 Global emissions associated with building sector (www.wri.org) [33]
0
50000
100000
150000
200000
250000
Thermal
Hydro
Nuclear
Renewable Energy
Resources
Fig. 2 Electricity generation scenario in India as on 30 June 2020 (www.cea.nic.in) [3]
buildings and associated emissions, the life cycle of a building can be divided into
three primary phases: construction, operation and maintenance; and finally demolition. In all these phases, buildings consumed high amount of energy and produce
GHG emissions, which are continuously increasing at massive rate [5, 24]. The