

equilibrated consumption of the “dosed-in PEL” because the point of 1:1 stoichiometry (not necessarily exactly at n
À /n
+
¼ 1) must not be exceeded. For the
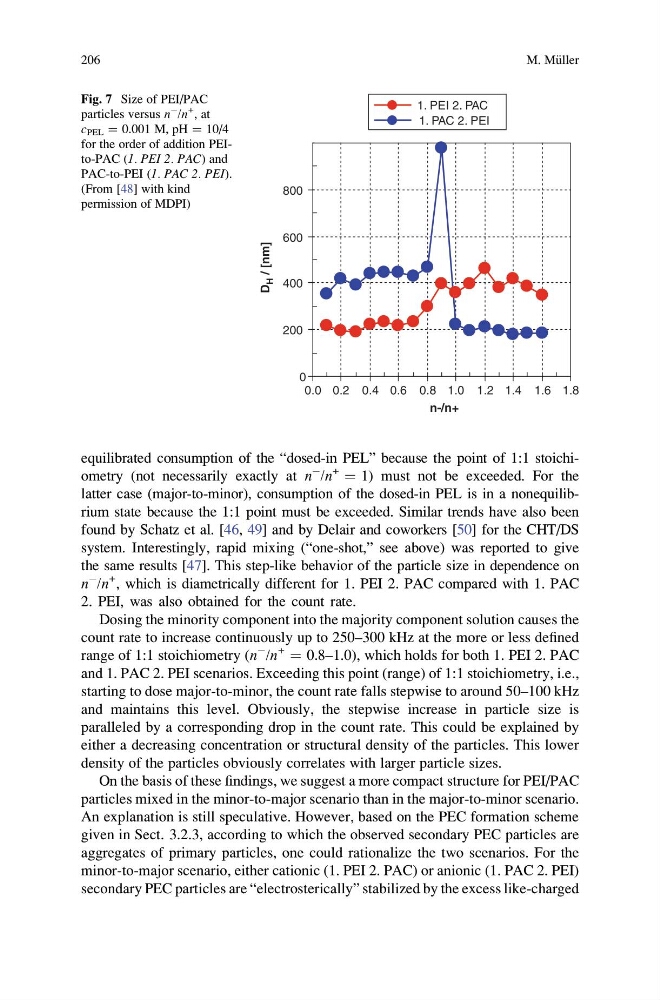
latter case (major-to-minor), consumption of the dosed-in PEL is in a nonequilibrium state because the 1:1 point must be exceeded. Similar trends have also been
found by Schatz et al. [46, 49] and by Delair and coworkers [50] for the CHT/DS
system. Interestingly, rapid mixing (“one-shot,” see above) was reported to give
the same results [47]. This step-like behavior of the particle size in dependence on
n
À /n
+
, which is diametrically different for 1. PEI 2. PAC compared with 1. PAC
2. PEI, was also obtained for the count rate.
Dosing the minority component into the majority component solution causes the
count rate to increase continuously up to 250–300 kHz at the more or less defined
range of 1:1 stoichiometry (n
À /n
+
¼ 0.8–1.0), which holds for both 1. PEI 2. PAC
and 1. PAC 2. PEI scenarios. Exceeding this point (range) of 1:1 stoichiometry, i.e.,
starting to dose major-to-minor, the count rate falls stepwise to around 50–100 kHz
and maintains this level. Obviously, the stepwise increase in particle size is
paralleled by a corresponding drop in the count rate. This could be explained by
either a decreasing concentration or structural density of the particles. This lower
density of the particles obviously correlates with larger particle sizes.
On the basis of these findings, we suggest a more compact structure for PEI/PAC
particles mixed in the minor-to-major scenario than in the major-to-minor scenario.
An explanation is still speculative. However, based on the PEC formation scheme
given in Sect. 3.2.3, according to which the observed secondary PEC particles are
aggregates of primary particles, one could rationalize the two scenarios. For the
minor-to-major scenario, either cationic (1. PEI 2. PAC) or anionic (1. PAC 2. PEI)
secondary PEC particles are “electrosterically” stabilized by the excess like-charged
0
200
400
600
800
0.0 0.2 0.4 0.6 0.8 1.0 1.2 1.4 1.6 1.8
n-/n+
D
H / [nm]
1. PEI 2. PAC
1. PAC 2. PEI
Fig. 7 Size of PEI/PAC
particles versus n
À /n
+
, at
c PEL ¼ 0.001 M, pH ¼ 10/4
for the order of addition PEIto-PAC (1. PEI 2. PAC) and
PAC-to-PEI (1. PAC 2. PEI).
(From [48] with kind
permission of MDPI)
206
M. M€ uller
À /n
+
¼ 1) must not be exceeded. For the
latter case (major-to-minor), consumption of the dosed-in PEL is in a nonequilibrium state because the 1:1 point must be exceeded. Similar trends have also been
found by Schatz et al. [46, 49] and by Delair and coworkers [50] for the CHT/DS
system. Interestingly, rapid mixing (“one-shot,” see above) was reported to give
the same results [47]. This step-like behavior of the particle size in dependence on
n
À /n
+
, which is diametrically different for 1. PEI 2. PAC compared with 1. PAC
2. PEI, was also obtained for the count rate.
Dosing the minority component into the majority component solution causes the
count rate to increase continuously up to 250–300 kHz at the more or less defined
range of 1:1 stoichiometry (n
À /n
+
¼ 0.8–1.0), which holds for both 1. PEI 2. PAC
and 1. PAC 2. PEI scenarios. Exceeding this point (range) of 1:1 stoichiometry, i.e.,
starting to dose major-to-minor, the count rate falls stepwise to around 50–100 kHz
and maintains this level. Obviously, the stepwise increase in particle size is
paralleled by a corresponding drop in the count rate. This could be explained by
either a decreasing concentration or structural density of the particles. This lower
density of the particles obviously correlates with larger particle sizes.
On the basis of these findings, we suggest a more compact structure for PEI/PAC
particles mixed in the minor-to-major scenario than in the major-to-minor scenario.
An explanation is still speculative. However, based on the PEC formation scheme
given in Sect. 3.2.3, according to which the observed secondary PEC particles are
aggregates of primary particles, one could rationalize the two scenarios. For the
minor-to-major scenario, either cationic (1. PEI 2. PAC) or anionic (1. PAC 2. PEI)
secondary PEC particles are “electrosterically” stabilized by the excess like-charged
0
200
400
600
800
0.0 0.2 0.4 0.6 0.8 1.0 1.2 1.4 1.6 1.8
n-/n+
D
H / [nm]
1. PEI 2. PAC
1. PAC 2. PEI
Fig. 7 Size of PEI/PAC
particles versus n
À /n
+
, at
c PEL ¼ 0.001 M, pH ¼ 10/4
for the order of addition PEIto-PAC (1. PEI 2. PAC) and
PAC-to-PEI (1. PAC 2. PEI).
(From [48] with kind
permission of MDPI)
206
M. M€ uller