

to one (GEL-1) and nine (GEL-9) consecutive freeze–thaw cycles (20 h at À22
C,
then 4 h at 25
C) are shown in Fig. 13 [60]. The SANS profile of the initial
homogeneous solution is also shown in Fig. 13a.
It is apparent that the scattering cross-section profile ðdσ=dΩÞ from the
homogeneous PVA solution denotes the presence of small scattering objects,
essentially corresponding to individual chains of PVA with a Gaussian coil conformation (Fig. 13a). This curve is different from those of PVA GEL-n samples,
indicating that PVA chains and solvent molecules are highly organized in these
gels. In the SANS profiles of the gels, three different regions can be distinguished:
1. A region at low q values (q < 0.09 nm
À1 ), where q ¼ 4π/(λ sinθ). In this region,
the scattering cross-section exhibits an upturn, which is not present in the SANS
curve of the initial homogeneous solution. In this zone, the data reflect a
supramolecular organization, which has been associated with the presence of
two separated phases constituted of polymer-rich and polymer-poor regions.
2. A region at intermediate q values (0.09 < q < 0.35 nm
À1 ). In this region, an
inflexion point is present at q*, which gives the average distance L between the
scattering crystallites, where L % 2π
q à . In all gel samples, this inflexion point
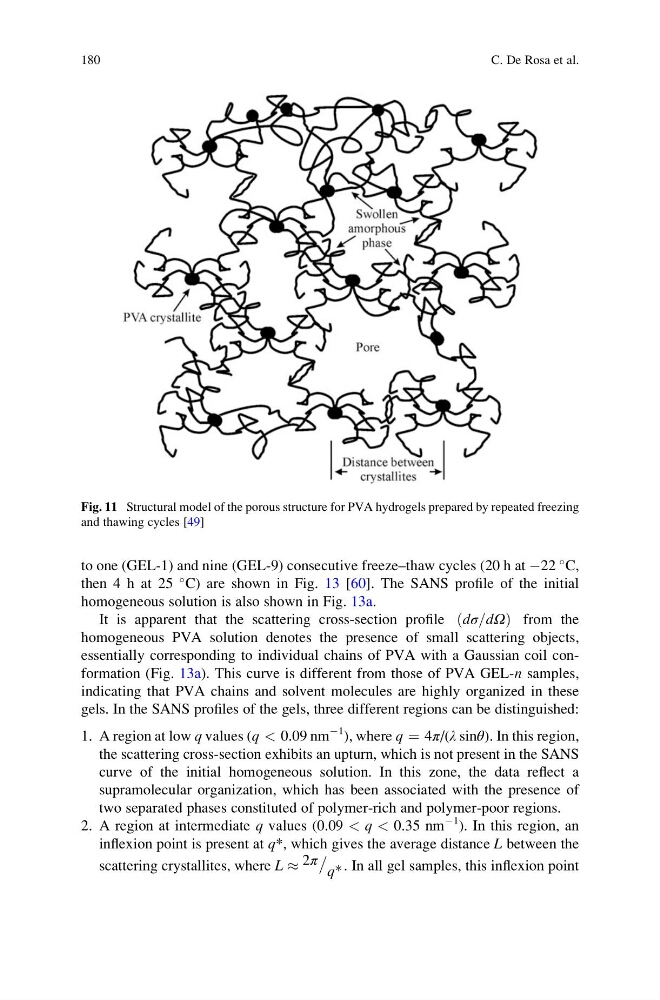
Fig. 11 Structural model of the porous structure for PVA hydrogels prepared by repeated freezing
and thawing cycles [49]
180
C. De Rosa et al.
C,
then 4 h at 25
C) are shown in Fig. 13 [60]. The SANS profile of the initial
homogeneous solution is also shown in Fig. 13a.
It is apparent that the scattering cross-section profile ðdσ=dΩÞ from the
homogeneous PVA solution denotes the presence of small scattering objects,
essentially corresponding to individual chains of PVA with a Gaussian coil conformation (Fig. 13a). This curve is different from those of PVA GEL-n samples,
indicating that PVA chains and solvent molecules are highly organized in these
gels. In the SANS profiles of the gels, three different regions can be distinguished:
1. A region at low q values (q < 0.09 nm
À1 ), where q ¼ 4π/(λ sinθ). In this region,
the scattering cross-section exhibits an upturn, which is not present in the SANS
curve of the initial homogeneous solution. In this zone, the data reflect a
supramolecular organization, which has been associated with the presence of
two separated phases constituted of polymer-rich and polymer-poor regions.
2. A region at intermediate q values (0.09 < q < 0.35 nm
À1 ). In this region, an
inflexion point is present at q*, which gives the average distance L between the
scattering crystallites, where L % 2π
q à . In all gel samples, this inflexion point
Fig. 11 Structural model of the porous structure for PVA hydrogels prepared by repeated freezing
and thawing cycles [49]
180
C. De Rosa et al.