

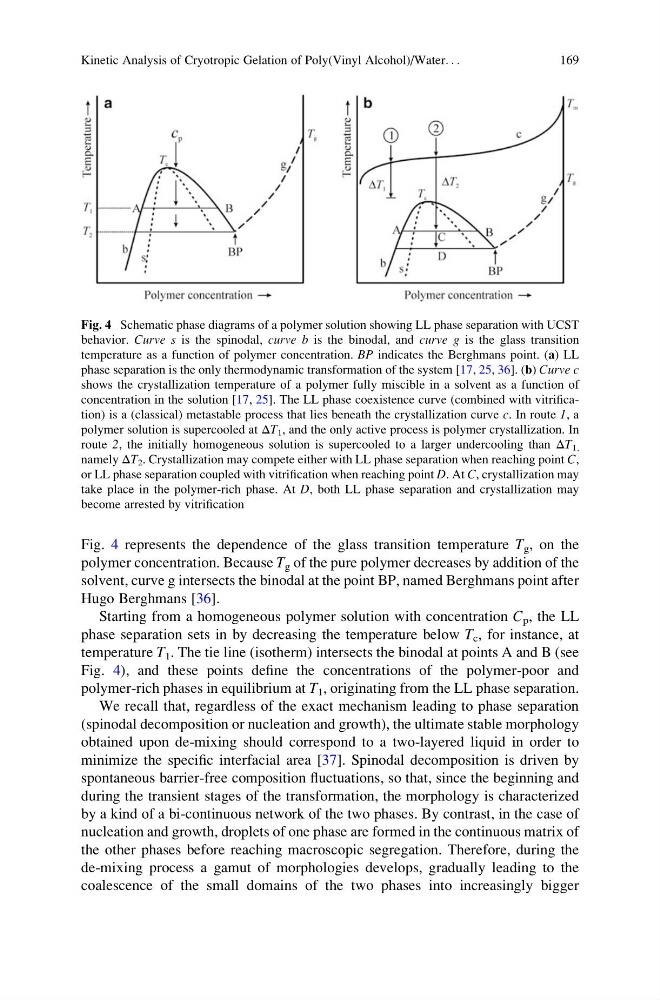
Fig. 4 represents the dependence of the glass transition temperature T g , on the
polymer concentration. Because T g of the pure polymer decreases by addition of the
solvent, curve g intersects the binodal at the point BP, named Berghmans point after
Hugo Berghmans [36].
Starting from a homogeneous polymer solution with concentration C p , the LL
phase separation sets in by decreasing the temperature below T c , for instance, at
temperature T 1 . The tie line (isotherm) intersects the binodal at points A and B (see
Fig. 4), and these points define the concentrations of the polymer-poor and
polymer-rich phases in equilibrium at T 1 , originating from the LL phase separation.
We recall that, regardless of the exact mechanism leading to phase separation
(spinodal decomposition or nucleation and growth), the ultimate stable morphology
obtained upon de-mixing should correspond to a two-layered liquid in order to
minimize the specific interfacial area [37]. Spinodal decomposition is driven by
spontaneous barrier-free composition fluctuations, so that, since the beginning and
during the transient stages of the transformation, the morphology is characterized
by a kind of a bi-continuous network of the two phases. By contrast, in the case of
nucleation and growth, droplets of one phase are formed in the continuous matrix of
the other phases before reaching macroscopic segregation. Therefore, during the
de-mixing process a gamut of morphologies develops, gradually leading to the
coalescence of the small domains of the two phases into increasingly bigger
Fig. 4 Schematic phase diagrams of a polymer solution showing LL phase separation with UCST
behavior. Curve s is the spinodal, curve b is the binodal, and curve g is the glass transition
temperature as a function of polymer concentration. BP indicates the Berghmans point. (a) LL
phase separation is the only thermodynamic transformation of the system [17, 25, 36]. (b) Curve c
shows the crystallization temperature of a polymer fully miscible in a solvent as a function of
concentration in the solution [17, 25]. The LL phase coexistence curve (combined with vitrification) is a (classical) metastable process that lies beneath the crystallization curve c. In route 1, a
polymer solution is supercooled at ΔT 1 , and the only active process is polymer crystallization. In
route 2, the initially homogeneous solution is supercooled to a larger undercooling than ΔT 1,
namely ΔT 2 . Crystallization may compete either with LL phase separation when reaching point C,
or LL phase separation coupled with vitrification when reaching point D. At C, crystallization may
take place in the polymer-rich phase. At D, both LL phase separation and crystallization may
become arrested by vitrification
Kinetic Analysis of Cryotropic Gelation of Poly(Vinyl Alcohol)/Water. . .
169
polymer concentration. Because T g of the pure polymer decreases by addition of the
solvent, curve g intersects the binodal at the point BP, named Berghmans point after
Hugo Berghmans [36].
Starting from a homogeneous polymer solution with concentration C p , the LL
phase separation sets in by decreasing the temperature below T c , for instance, at
temperature T 1 . The tie line (isotherm) intersects the binodal at points A and B (see
Fig. 4), and these points define the concentrations of the polymer-poor and
polymer-rich phases in equilibrium at T 1 , originating from the LL phase separation.
We recall that, regardless of the exact mechanism leading to phase separation
(spinodal decomposition or nucleation and growth), the ultimate stable morphology
obtained upon de-mixing should correspond to a two-layered liquid in order to
minimize the specific interfacial area [37]. Spinodal decomposition is driven by
spontaneous barrier-free composition fluctuations, so that, since the beginning and
during the transient stages of the transformation, the morphology is characterized
by a kind of a bi-continuous network of the two phases. By contrast, in the case of
nucleation and growth, droplets of one phase are formed in the continuous matrix of
the other phases before reaching macroscopic segregation. Therefore, during the
de-mixing process a gamut of morphologies develops, gradually leading to the
coalescence of the small domains of the two phases into increasingly bigger
Fig. 4 Schematic phase diagrams of a polymer solution showing LL phase separation with UCST
behavior. Curve s is the spinodal, curve b is the binodal, and curve g is the glass transition
temperature as a function of polymer concentration. BP indicates the Berghmans point. (a) LL
phase separation is the only thermodynamic transformation of the system [17, 25, 36]. (b) Curve c
shows the crystallization temperature of a polymer fully miscible in a solvent as a function of
concentration in the solution [17, 25]. The LL phase coexistence curve (combined with vitrification) is a (classical) metastable process that lies beneath the crystallization curve c. In route 1, a
polymer solution is supercooled at ΔT 1 , and the only active process is polymer crystallization. In
route 2, the initially homogeneous solution is supercooled to a larger undercooling than ΔT 1,
namely ΔT 2 . Crystallization may compete either with LL phase separation when reaching point C,
or LL phase separation coupled with vitrification when reaching point D. At C, crystallization may
take place in the polymer-rich phase. At D, both LL phase separation and crystallization may
become arrested by vitrification
Kinetic Analysis of Cryotropic Gelation of Poly(Vinyl Alcohol)/Water. . .
169