

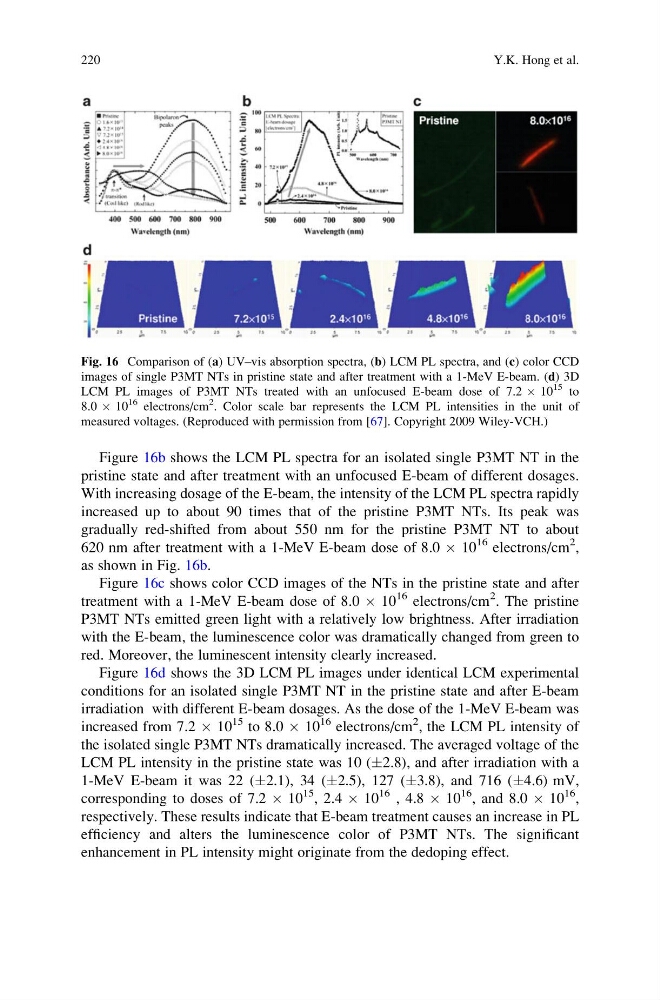
Figure 16b shows the LCM PL spectra for an isolated single P3MT NT in the
pristine state and after treatment with an unfocused E-beam of different dosages.
With increasing dosage of the E-beam, the intensity of the LCM PL spectra rapidly
increased up to about 90 times that of the pristine P3MT NTs. Its peak was
gradually red-shifted from about 550 nm for the pristine P3MT NT to about
620 nm after treatment with a 1-MeV E-beam dose of 8.0 Â 10
16 electrons/cm
2 ,
as shown in Fig. 16b.
Figure 16c shows color CCD images of the NTs in the pristine state and after
treatment with a 1-MeV E-beam dose of 8.0 Â 10
16 electrons/cm
2 . The pristine
P3MT NTs emitted green light with a relatively low brightness. After irradiation
with the E-beam, the luminescence color was dramatically changed from green to
red. Moreover, the luminescent intensity clearly increased.
Figure 16d shows the 3D LCM PL images under identical LCM experimental
conditions for an isolated single P3MT NT in the pristine state and after E-beam
irradiation with different E-beam dosages. As the dose of the 1-MeV E-beam was
increased from 7.2 Â 10
15 to 8.0 Â 10
16 electrons/cm
2 , the LCM PL intensity of
the isolated single P3MT NTs dramatically increased. The averaged voltage of the
LCM PL intensity in the pristine state was 10 (Æ2.8), and after irradiation with a
1-MeV E-beam it was 22 (Æ2.1), 34 (Æ2.5), 127 (Æ3.8), and 716 (Æ4.6) mV,
corresponding to doses of 7.2 Â 10
15 , 2.4 Â 10
16 , 4.8 Â 10
16 , and 8.0 Â 10
16 ,
respectively. These results indicate that E-beam treatment causes an increase in PL
efficiency and alters the luminescence color of P3MT NTs. The significant
enhancement in PL intensity might originate from the dedoping effect.
Fig. 16 Comparison of (a) UV–vis absorption spectra, (b) LCM PL spectra, and (c) color CCD
images of single P3MT NTs in pristine state and after treatment with a 1-MeV E-beam. (d) 3D
LCM PL images of P3MT NTs treated with an unfocused E-beam dose of 7.2 Â 10
15 to
8.0 Â 10
16 electrons/cm
2
. Color scale bar represents the LCM PL intensities in the unit of
measured voltages. (Reproduced with permission from [67]. Copyright 2009 Wiley-VCH.)
220
Y.K. Hong et al.
pristine state and after treatment with an unfocused E-beam of different dosages.
With increasing dosage of the E-beam, the intensity of the LCM PL spectra rapidly
increased up to about 90 times that of the pristine P3MT NTs. Its peak was
gradually red-shifted from about 550 nm for the pristine P3MT NT to about
620 nm after treatment with a 1-MeV E-beam dose of 8.0 Â 10
16 electrons/cm
2 ,
as shown in Fig. 16b.
Figure 16c shows color CCD images of the NTs in the pristine state and after
treatment with a 1-MeV E-beam dose of 8.0 Â 10
16 electrons/cm
2 . The pristine
P3MT NTs emitted green light with a relatively low brightness. After irradiation
with the E-beam, the luminescence color was dramatically changed from green to
red. Moreover, the luminescent intensity clearly increased.
Figure 16d shows the 3D LCM PL images under identical LCM experimental
conditions for an isolated single P3MT NT in the pristine state and after E-beam
irradiation with different E-beam dosages. As the dose of the 1-MeV E-beam was
increased from 7.2 Â 10
15 to 8.0 Â 10
16 electrons/cm
2 , the LCM PL intensity of
the isolated single P3MT NTs dramatically increased. The averaged voltage of the
LCM PL intensity in the pristine state was 10 (Æ2.8), and after irradiation with a
1-MeV E-beam it was 22 (Æ2.1), 34 (Æ2.5), 127 (Æ3.8), and 716 (Æ4.6) mV,
corresponding to doses of 7.2 Â 10
15 , 2.4 Â 10
16 , 4.8 Â 10
16 , and 8.0 Â 10
16 ,
respectively. These results indicate that E-beam treatment causes an increase in PL
efficiency and alters the luminescence color of P3MT NTs. The significant
enhancement in PL intensity might originate from the dedoping effect.
Fig. 16 Comparison of (a) UV–vis absorption spectra, (b) LCM PL spectra, and (c) color CCD
images of single P3MT NTs in pristine state and after treatment with a 1-MeV E-beam. (d) 3D
LCM PL images of P3MT NTs treated with an unfocused E-beam dose of 7.2 Â 10
15 to
8.0 Â 10
16 electrons/cm
2
. Color scale bar represents the LCM PL intensities in the unit of
measured voltages. (Reproduced with permission from [67]. Copyright 2009 Wiley-VCH.)
220
Y.K. Hong et al.