

48
M. Maity et al.
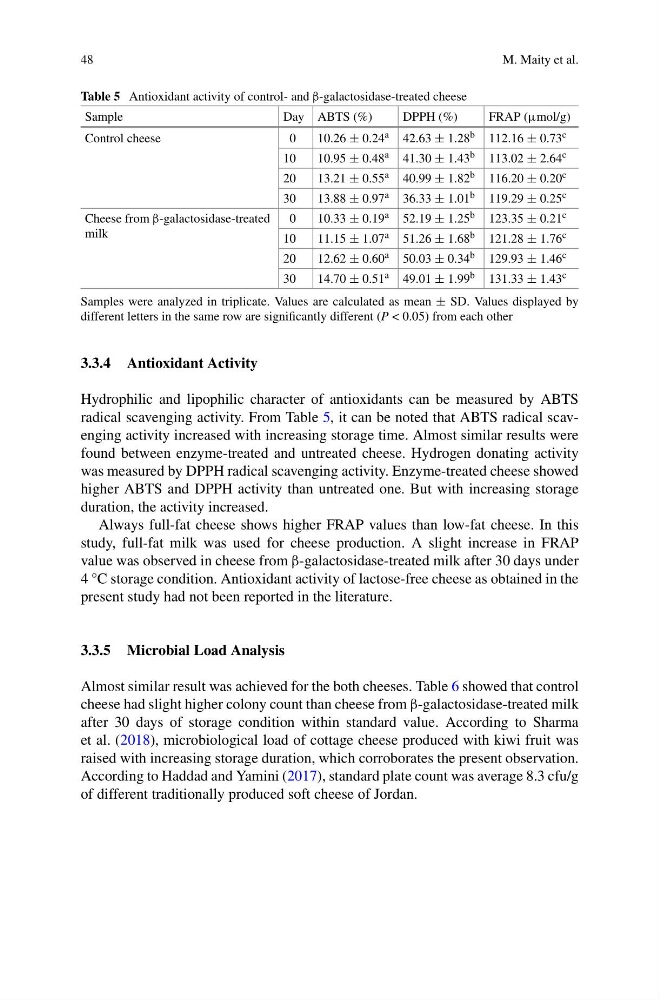
Table 5 Antioxidant activity of control- and β-galactosidase-treated cheese
Sample
Day ABTS (%)
DPPH (%)
FRAP (μmol/g)
Control cheese
0
10.26 ± 0.24 a 42.63 ± 1.28 b 112.16 ± 0.73 c
10
10.95 ± 0.48 a 41.30 ± 1.43 b 113.02 ± 2.64 c
20
13.21 ± 0.55 a 40.99 ± 1.82 b 116.20 ± 0.20 c
30
13.88 ± 0.97 a 36.33 ± 1.01 b 119.29 ± 0.25 c
Cheese from β-galactosidase-treated
milk
0
10.33 ± 0.19 a 52.19 ± 1.25 b 123.35 ± 0.21 c
10
11.15 ± 1.07 a 51.26 ± 1.68 b 121.28 ± 1.76 c
20
12.62 ± 0.60 a 50.03 ± 0.34 b 129.93 ± 1.46 c
30
14.70 ± 0.51 a 49.01 ± 1.99 b 131.33 ± 1.43 c
Samples were analyzed in triplicate. Values are calculated as mean ± SD. Values displayed by
different letters in the same row are significantly different (P < 0.05) from each other
3.3.4 Antioxidant Activity
Hydrophilic and lipophilic character of antioxidants can be measured by ABTS
radical scavenging activity. From Table 5, it can be noted that ABTS radical scavenging activity increased with increasing storage time. Almost similar results were
found between enzyme-treated and untreated cheese. Hydrogen donating activity
was measured by DPPH radical scavenging activity. Enzyme-treated cheese showed
higher ABTS and DPPH activity than untreated one. But with increasing storage
duration, the activity increased.
Always full-fat cheese shows higher FRAP values than low-fat cheese. In this
study, full-fat milk was used for cheese production. A slight increase in FRAP
value was observed in cheese from β-galactosidase-treated milk after 30 days under
4 °C storage condition. Antioxidant activity of lactose-free cheese as obtained in the
present study had not been reported in the literature.
3.3.5 Microbial Load Analysis
Almost similar result was achieved for the both cheeses. Table 6 showed that control
cheese had slight higher colony count than cheese from β-galactosidase-treated milk
after 30 days of storage condition within standard value. According to Sharma
et al. (2018), microbiological load of cottage cheese produced with kiwi fruit was
raised with increasing storage duration, which corroborates the present observation.
According to Haddad and Yamini (2017), standard plate count was average 8.3 cfu/g
of different traditionally produced soft cheese of Jordan.
M. Maity et al.
Table 5 Antioxidant activity of control- and β-galactosidase-treated cheese
Sample
Day ABTS (%)
DPPH (%)
FRAP (μmol/g)
Control cheese
0
10.26 ± 0.24 a 42.63 ± 1.28 b 112.16 ± 0.73 c
10
10.95 ± 0.48 a 41.30 ± 1.43 b 113.02 ± 2.64 c
20
13.21 ± 0.55 a 40.99 ± 1.82 b 116.20 ± 0.20 c
30
13.88 ± 0.97 a 36.33 ± 1.01 b 119.29 ± 0.25 c
Cheese from β-galactosidase-treated
milk
0
10.33 ± 0.19 a 52.19 ± 1.25 b 123.35 ± 0.21 c
10
11.15 ± 1.07 a 51.26 ± 1.68 b 121.28 ± 1.76 c
20
12.62 ± 0.60 a 50.03 ± 0.34 b 129.93 ± 1.46 c
30
14.70 ± 0.51 a 49.01 ± 1.99 b 131.33 ± 1.43 c
Samples were analyzed in triplicate. Values are calculated as mean ± SD. Values displayed by
different letters in the same row are significantly different (P < 0.05) from each other
3.3.4 Antioxidant Activity
Hydrophilic and lipophilic character of antioxidants can be measured by ABTS
radical scavenging activity. From Table 5, it can be noted that ABTS radical scavenging activity increased with increasing storage time. Almost similar results were
found between enzyme-treated and untreated cheese. Hydrogen donating activity
was measured by DPPH radical scavenging activity. Enzyme-treated cheese showed
higher ABTS and DPPH activity than untreated one. But with increasing storage
duration, the activity increased.
Always full-fat cheese shows higher FRAP values than low-fat cheese. In this
study, full-fat milk was used for cheese production. A slight increase in FRAP
value was observed in cheese from β-galactosidase-treated milk after 30 days under
4 °C storage condition. Antioxidant activity of lactose-free cheese as obtained in the
present study had not been reported in the literature.
3.3.5 Microbial Load Analysis
Almost similar result was achieved for the both cheeses. Table 6 showed that control
cheese had slight higher colony count than cheese from β-galactosidase-treated milk
after 30 days of storage condition within standard value. According to Sharma
et al. (2018), microbiological load of cottage cheese produced with kiwi fruit was
raised with increasing storage duration, which corroborates the present observation.
According to Haddad and Yamini (2017), standard plate count was average 8.3 cfu/g
of different traditionally produced soft cheese of Jordan.