

376
S. Mitra et al.
double distilled water till the pH of the mixture became neutral. Finally, it was dried
in a vacuum oven at 60 °C and referred to as MRGO.
2.4 Measurements and Characterizations
The GO and MRGO were dispersed in water and sonicated for 30 min in an ultrasonicator (Labman Scientific Instruments) to ensure their dispersion in the solvent.
The dispersed samples were then analyzed using UV–Vis spectroscopy (PerkinElmer Lamda 8000). X-ray diffraction (XRD) studies were carried out at room
temperature at a scan rate of 5°/min (Bruker D8 Advance) with Cu-Kα targets (λ =
0.154 nm). Raman spectra of the prepared GO and MRGO samples were performed
on a Raman Microscope (WItec Alpha 300R) in the range of 500–3000 cm
−1 using a
He–Ne laser beam. Thermogravimetric analysis (TGA) was carried out at a heating
rate of 5 °C/min from 50 to 600 °C in air. X-ray photoelectron spectroscopy (XPS)
was carried out in PHI 5000 Versa Probe III using Al-Kα X-ray source.
3 Results and Discussion
3.1 XRD Analysis
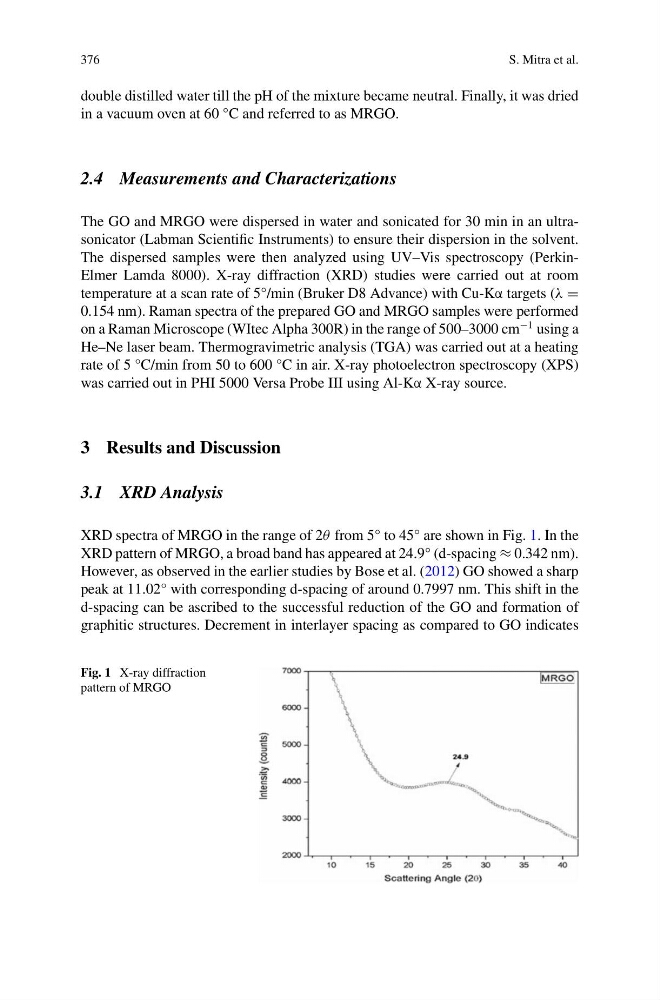
XRD spectra of MRGO in the range of 2θ from 5° to 45° are shown in Fig. 1. In the
XRD pattern of MRGO, a broad band has appeared at 24.9° (d-spacing ≈ 0.342 nm).
However, as observed in the earlier studies by Bose et al. (2012) GO showed a sharp
peak at 11.02° with corresponding d-spacing of around 0.7997 nm. This shift in the
d-spacing can be ascribed to the successful reduction of the GO and formation of
graphitic structures. Decrement in interlayer spacing as compared to GO indicates
Fig. 1 X-ray diffraction
pattern of MRGO
S. Mitra et al.
double distilled water till the pH of the mixture became neutral. Finally, it was dried
in a vacuum oven at 60 °C and referred to as MRGO.
2.4 Measurements and Characterizations
The GO and MRGO were dispersed in water and sonicated for 30 min in an ultrasonicator (Labman Scientific Instruments) to ensure their dispersion in the solvent.
The dispersed samples were then analyzed using UV–Vis spectroscopy (PerkinElmer Lamda 8000). X-ray diffraction (XRD) studies were carried out at room
temperature at a scan rate of 5°/min (Bruker D8 Advance) with Cu-Kα targets (λ =
0.154 nm). Raman spectra of the prepared GO and MRGO samples were performed
on a Raman Microscope (WItec Alpha 300R) in the range of 500–3000 cm
−1 using a
He–Ne laser beam. Thermogravimetric analysis (TGA) was carried out at a heating
rate of 5 °C/min from 50 to 600 °C in air. X-ray photoelectron spectroscopy (XPS)
was carried out in PHI 5000 Versa Probe III using Al-Kα X-ray source.
3 Results and Discussion
3.1 XRD Analysis
XRD spectra of MRGO in the range of 2θ from 5° to 45° are shown in Fig. 1. In the
XRD pattern of MRGO, a broad band has appeared at 24.9° (d-spacing ≈ 0.342 nm).
However, as observed in the earlier studies by Bose et al. (2012) GO showed a sharp
peak at 11.02° with corresponding d-spacing of around 0.7997 nm. This shift in the
d-spacing can be ascribed to the successful reduction of the GO and formation of
graphitic structures. Decrement in interlayer spacing as compared to GO indicates
Fig. 1 X-ray diffraction
pattern of MRGO