

332
K. Biswas and M. Rahaman
3 Results and Discussion
3.1 Analysis of Iron Removal and Determination
of Condition
The electrocoagulation process of iron solution was performed with a set of parametric conditions obtained by experimental matrix design using L 16 orthogonal array
approach. The percentage removal efficiency of iron was as a response and is shown
in Table 2. In order to determine the effective parameters and their significance levels
on removal efficiency, a statistical analysis of variance (ANOVA) was performed.
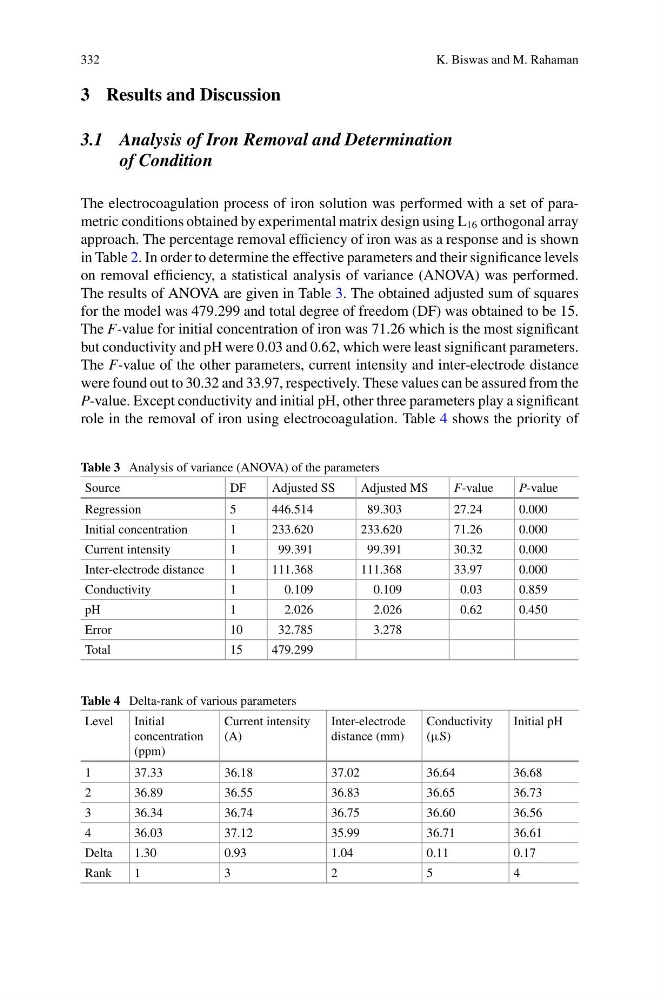
The results of ANOVA are given in Table 3. The obtained adjusted sum of squares
for the model was 479.299 and total degree of freedom (DF) was obtained to be 15.
The F-value for initial concentration of iron was 71.26 which is the most significant
but conductivity and pH were 0.03 and 0.62, which were least significant parameters.
The F-value of the other parameters, current intensity and inter-electrode distance
were found out to 30.32 and 33.97, respectively. These values can be assured from the
P-value. Except conductivity and initial pH, other three parameters play a significant
role in the removal of iron using electrocoagulation. Table 4 shows the priority of
Table 3 Analysis of variance (ANOVA) of the parameters
Source
DF
Adjusted SS
Adjusted MS
F-value
P-value
Regression
5
446.514
89.303
27.24
0.000
Initial concentration
1
233.620
233.620
71.26
0.000
Current intensity
1
99.391
99.391
30.32
0.000
Inter-electrode distance
1
111.368
111.368
33.97
0.000
Conductivity
1
0.109
0.109
0.03
0.859
pH
1
2.026
2.026
0.62
0.450
Error
10
32.785
3.278
Total
15
479.299
Table 4 Delta-rank of various parameters
Level
Initial
concentration
(ppm)
Current intensity
(A)
Inter-electrode
distance (mm)
Conductivity
(µS)
Initial pH
1
37.33
36.18
37.02
36.64
36.68
2
36.89
36.55
36.83
36.65
36.73
3
36.34
36.74
36.75
36.60
36.56
4
36.03
37.12
35.99
36.71
36.61
Delta
1.30
0.93
1.04
0.11
0.17
Rank
1
3
2
5
4
K. Biswas and M. Rahaman
3 Results and Discussion
3.1 Analysis of Iron Removal and Determination
of Condition
The electrocoagulation process of iron solution was performed with a set of parametric conditions obtained by experimental matrix design using L 16 orthogonal array
approach. The percentage removal efficiency of iron was as a response and is shown
in Table 2. In order to determine the effective parameters and their significance levels
on removal efficiency, a statistical analysis of variance (ANOVA) was performed.
The results of ANOVA are given in Table 3. The obtained adjusted sum of squares
for the model was 479.299 and total degree of freedom (DF) was obtained to be 15.
The F-value for initial concentration of iron was 71.26 which is the most significant
but conductivity and pH were 0.03 and 0.62, which were least significant parameters.
The F-value of the other parameters, current intensity and inter-electrode distance
were found out to 30.32 and 33.97, respectively. These values can be assured from the
P-value. Except conductivity and initial pH, other three parameters play a significant
role in the removal of iron using electrocoagulation. Table 4 shows the priority of
Table 3 Analysis of variance (ANOVA) of the parameters
Source
DF
Adjusted SS
Adjusted MS
F-value
P-value
Regression
5
446.514
89.303
27.24
0.000
Initial concentration
1
233.620
233.620
71.26
0.000
Current intensity
1
99.391
99.391
30.32
0.000
Inter-electrode distance
1
111.368
111.368
33.97
0.000
Conductivity
1
0.109
0.109
0.03
0.859
pH
1
2.026
2.026
0.62
0.450
Error
10
32.785
3.278
Total
15
479.299
Table 4 Delta-rank of various parameters
Level
Initial
concentration
(ppm)
Current intensity
(A)
Inter-electrode
distance (mm)
Conductivity
(µS)
Initial pH
1
37.33
36.18
37.02
36.64
36.68
2
36.89
36.55
36.83
36.65
36.73
3
36.34
36.74
36.75
36.60
36.56
4
36.03
37.12
35.99
36.71
36.61
Delta
1.30
0.93
1.04
0.11
0.17
Rank
1
3
2
5
4