

330
K. Biswas and M. Rahaman
Table 2 L 16 experimental matrix from Taguchi method
Experiment
number
Initial
concentration
(ppm)
Current
intensity
(A)
Inter-electrode
distance (mm)
Conductivity
(µS)
Initial
pH
Percentage
removal of
iron
1
15
0.50
8
345
5
73.02
2
15
0.75
10
355
6
74.98
3
15
1.00
12
365
7
74.05
4
15
1.25
14
375
8
72.08
5
20
0.50
10
365
8
67.03
6
20
0.75
8
375
7
71.99
7
20
1.00
14
345
6
66.08
8
20
1.25
12
355
5
74.95
9
25
0.50
12
375
6
63.97
10
25
0.75
14
365
5
60.07
11
25
1.00
8
355
8
69.02
12
25
1.25
10
345
7
70.04
13
30
0.50
14
355
7
55.06
14
30
0.75
12
345
8
63.05
15
30
1.00
10
375
5
66.08
16
30
1.25
8
365
6
70.02
2.3 Experimental Setup and Procedure
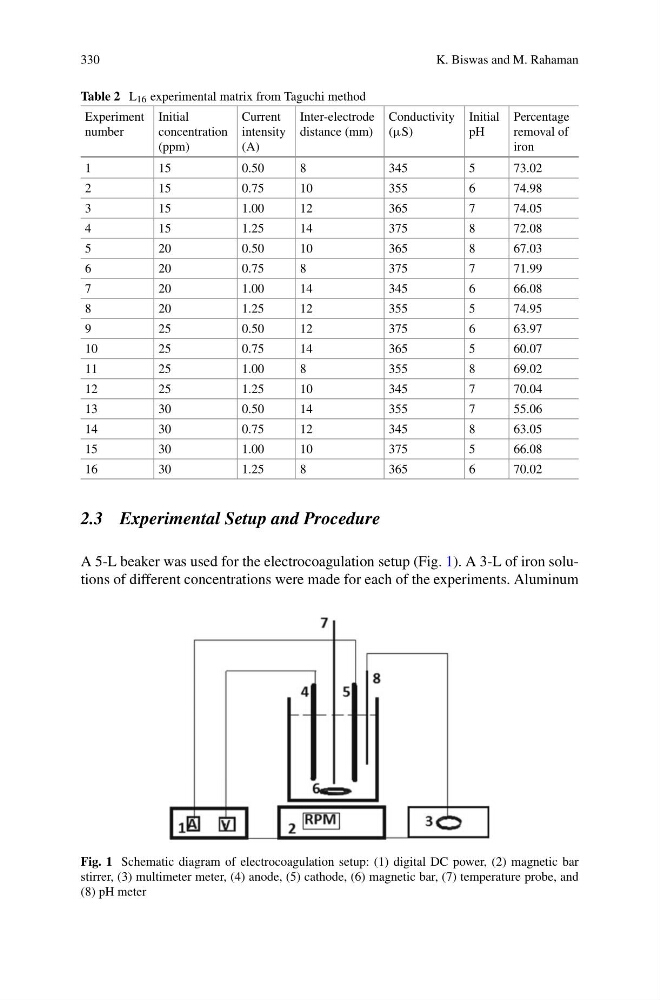
A 5-L beaker was used for the electrocoagulation setup (Fig. 1). A 3-L of iron solutions of different concentrations were made for each of the experiments. Aluminum
Fig. 1 Schematic diagram of electrocoagulation setup: (1) digital DC power, (2) magnetic bar
stirrer, (3) multimeter meter, (4) anode, (5) cathode, (6) magnetic bar, (7) temperature probe, and
(8) pH meter
K. Biswas and M. Rahaman
Table 2 L 16 experimental matrix from Taguchi method
Experiment
number
Initial
concentration
(ppm)
Current
intensity
(A)
Inter-electrode
distance (mm)
Conductivity
(µS)
Initial
pH
Percentage
removal of
iron
1
15
0.50
8
345
5
73.02
2
15
0.75
10
355
6
74.98
3
15
1.00
12
365
7
74.05
4
15
1.25
14
375
8
72.08
5
20
0.50
10
365
8
67.03
6
20
0.75
8
375
7
71.99
7
20
1.00
14
345
6
66.08
8
20
1.25
12
355
5
74.95
9
25
0.50
12
375
6
63.97
10
25
0.75
14
365
5
60.07
11
25
1.00
8
355
8
69.02
12
25
1.25
10
345
7
70.04
13
30
0.50
14
355
7
55.06
14
30
0.75
12
345
8
63.05
15
30
1.00
10
375
5
66.08
16
30
1.25
8
365
6
70.02
2.3 Experimental Setup and Procedure
A 5-L beaker was used for the electrocoagulation setup (Fig. 1). A 3-L of iron solutions of different concentrations were made for each of the experiments. Aluminum
Fig. 1 Schematic diagram of electrocoagulation setup: (1) digital DC power, (2) magnetic bar
stirrer, (3) multimeter meter, (4) anode, (5) cathode, (6) magnetic bar, (7) temperature probe, and
(8) pH meter