

Synthesis and Characterization of MgO Nanoparticle …
201
of parent and stabilizing agent, and pH was maintained constantly as observed in
standardization process. Occurrence of a white precipitate was observed indicating
the completion of the reaction of MgO compound. The precipitate was filtered and
washed with distilled water. The solution was centrifuged at 3000 rpm for 5 min and
the precipitate was dried at 60 °C for 7 h. The white powder is grinded vigorously.
However, the synthesis conditions were optimized for the current reaction by varying
various parameters. Various concentrations of MgNO 3 , ranging from 0.2 M to 0.5 M,
were used with volume 50 ml. The mixture was stirred continuously using a magnetic
stirrer varying the stirring duration from 3 to 5 h and the pH was maintained at values
of 9, 10, 11, and 12 using 0.5 M NaOH solution. The reaction temperature was maintained at 60 and 80 °C. The same temperature at which synthesis was carried out was
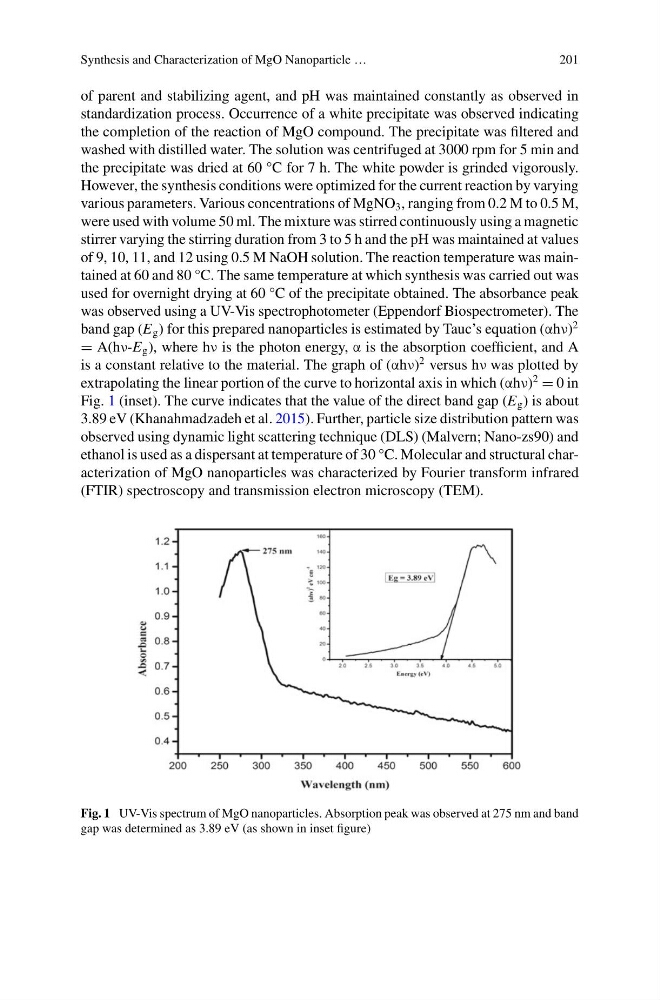
used for overnight drying at 60 °C of the precipitate obtained. The absorbance peak
was observed using a UV-Vis spectrophotometer (Eppendorf Biospectrometer). The
band gap (E g ) for this prepared nanoparticles is estimated by Tauc’s equation (αhν)
2
= A(hν-E g ), where hν is the photon energy, α is the absorption coefficient, and A
is a constant relative to the material. The graph of (αhν)
2 versus hν was plotted by
extrapolating the linear portion of the curve to horizontal axis in which (αhν)
2
= 0 in
Fig. 1 (inset). The curve indicates that the value of the direct band gap (E g ) is about
3.89 eV (Khanahmadzadeh et al. 2015). Further, particle size distribution pattern was
observed using dynamic light scattering technique (DLS) (Malvern; Nano-zs90) and
ethanol is used as a dispersant at temperature of 30 °C. Molecular and structural characterization of MgO nanoparticles was characterized by Fourier transform infrared
(FTIR) spectroscopy and transmission electron microscopy (TEM).
Fig. 1 UV-Vis spectrum of MgO nanoparticles. Absorption peak was observed at 275 nm and band
gap was determined as 3.89 eV (as shown in inset figure)
201
of parent and stabilizing agent, and pH was maintained constantly as observed in
standardization process. Occurrence of a white precipitate was observed indicating
the completion of the reaction of MgO compound. The precipitate was filtered and
washed with distilled water. The solution was centrifuged at 3000 rpm for 5 min and
the precipitate was dried at 60 °C for 7 h. The white powder is grinded vigorously.
However, the synthesis conditions were optimized for the current reaction by varying
various parameters. Various concentrations of MgNO 3 , ranging from 0.2 M to 0.5 M,
were used with volume 50 ml. The mixture was stirred continuously using a magnetic
stirrer varying the stirring duration from 3 to 5 h and the pH was maintained at values
of 9, 10, 11, and 12 using 0.5 M NaOH solution. The reaction temperature was maintained at 60 and 80 °C. The same temperature at which synthesis was carried out was
used for overnight drying at 60 °C of the precipitate obtained. The absorbance peak
was observed using a UV-Vis spectrophotometer (Eppendorf Biospectrometer). The
band gap (E g ) for this prepared nanoparticles is estimated by Tauc’s equation (αhν)
2
= A(hν-E g ), where hν is the photon energy, α is the absorption coefficient, and A
is a constant relative to the material. The graph of (αhν)
2 versus hν was plotted by
extrapolating the linear portion of the curve to horizontal axis in which (αhν)
2
= 0 in
Fig. 1 (inset). The curve indicates that the value of the direct band gap (E g ) is about
3.89 eV (Khanahmadzadeh et al. 2015). Further, particle size distribution pattern was
observed using dynamic light scattering technique (DLS) (Malvern; Nano-zs90) and
ethanol is used as a dispersant at temperature of 30 °C. Molecular and structural characterization of MgO nanoparticles was characterized by Fourier transform infrared
(FTIR) spectroscopy and transmission electron microscopy (TEM).
Fig. 1 UV-Vis spectrum of MgO nanoparticles. Absorption peak was observed at 275 nm and band
gap was determined as 3.89 eV (as shown in inset figure)