

The Tribological Behavior of an In-Situ Processed Magnesium …
85
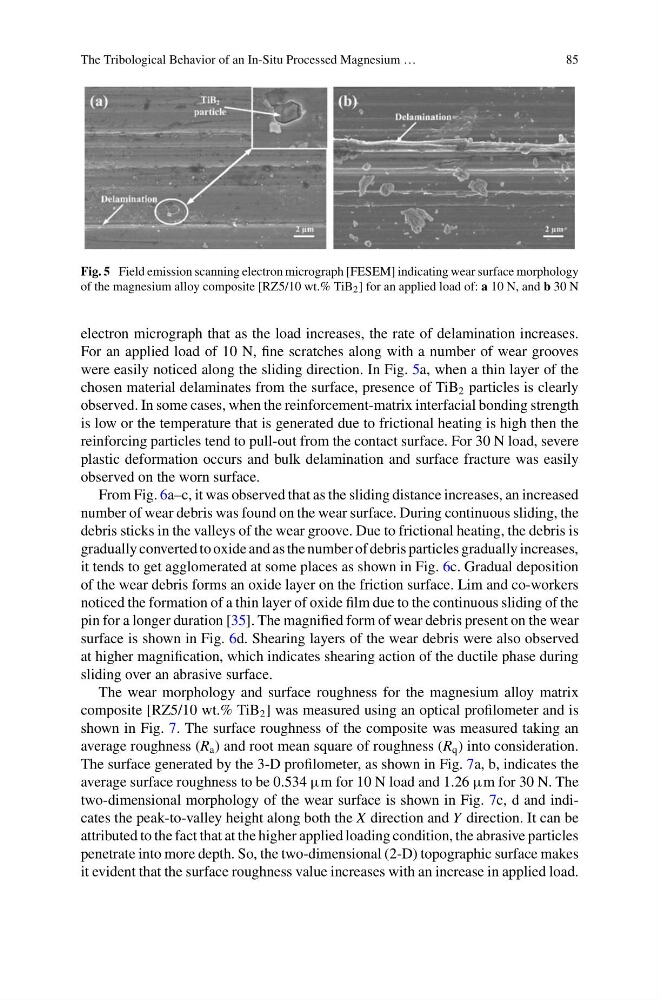
Fig. 5 Field emission scanning electron micrograph [FESEM] indicating wear surface morphology
of the magnesium alloy composite [RZ5/10 wt.% TiB 2 ] for an applied load of: a 10 N, and b 30 N
electron micrograph that as the load increases, the rate of delamination increases.
For an applied load of 10 N, fine scratches along with a number of wear grooves
were easily noticed along the sliding direction. In Fig. 5a, when a thin layer of the
chosen material delaminates from the surface, presence of TiB 2 particles is clearly
observed. In some cases, when the reinforcement-matrix interfacial bonding strength
is low or the temperature that is generated due to frictional heating is high then the
reinforcing particles tend to pull-out from the contact surface. For 30 N load, severe
plastic deformation occurs and bulk delamination and surface fracture was easily
observed on the worn surface.
From Fig. 6a–c, it was observed that as the sliding distance increases, an increased
number of wear debris was found on the wear surface. During continuous sliding, the
debris sticks in the valleys of the wear groove. Due to frictional heating, the debris is
gradually converted to oxide and as the number of debris particles gradually increases,
it tends to get agglomerated at some places as shown in Fig. 6c. Gradual deposition
of the wear debris forms an oxide layer on the friction surface. Lim and co-workers
noticed the formation of a thin layer of oxide film due to the continuous sliding of the
pin for a longer duration [35]. The magnified form of wear debris present on the wear
surface is shown in Fig. 6d. Shearing layers of the wear debris were also observed
at higher magnification, which indicates shearing action of the ductile phase during
sliding over an abrasive surface.
The wear morphology and surface roughness for the magnesium alloy matrix
composite [RZ5/10 wt.% TiB 2 ] was measured using an optical profilometer and is
shown in Fig. 7. The surface roughness of the composite was measured taking an
average roughness (R a ) and root mean square of roughness (R q ) into consideration.
The surface generated by the 3-D profilometer, as shown in Fig. 7a, b, indicates the
average surface roughness to be 0.534 µm for 10 N load and 1.26 µm for 30 N. The
two-dimensional morphology of the wear surface is shown in Fig. 7c, d and indicates the peak-to-valley height along both the X direction and Y direction. It can be
attributed to the fact that at the higher applied loading condition, the abrasive particles
penetrate into more depth. So, the two-dimensional (2-D) topographic surface makes
it evident that the surface roughness value increases with an increase in applied load.
85
Fig. 5 Field emission scanning electron micrograph [FESEM] indicating wear surface morphology
of the magnesium alloy composite [RZ5/10 wt.% TiB 2 ] for an applied load of: a 10 N, and b 30 N
electron micrograph that as the load increases, the rate of delamination increases.
For an applied load of 10 N, fine scratches along with a number of wear grooves
were easily noticed along the sliding direction. In Fig. 5a, when a thin layer of the
chosen material delaminates from the surface, presence of TiB 2 particles is clearly
observed. In some cases, when the reinforcement-matrix interfacial bonding strength
is low or the temperature that is generated due to frictional heating is high then the
reinforcing particles tend to pull-out from the contact surface. For 30 N load, severe
plastic deformation occurs and bulk delamination and surface fracture was easily
observed on the worn surface.
From Fig. 6a–c, it was observed that as the sliding distance increases, an increased
number of wear debris was found on the wear surface. During continuous sliding, the
debris sticks in the valleys of the wear groove. Due to frictional heating, the debris is
gradually converted to oxide and as the number of debris particles gradually increases,
it tends to get agglomerated at some places as shown in Fig. 6c. Gradual deposition
of the wear debris forms an oxide layer on the friction surface. Lim and co-workers
noticed the formation of a thin layer of oxide film due to the continuous sliding of the
pin for a longer duration [35]. The magnified form of wear debris present on the wear
surface is shown in Fig. 6d. Shearing layers of the wear debris were also observed
at higher magnification, which indicates shearing action of the ductile phase during
sliding over an abrasive surface.
The wear morphology and surface roughness for the magnesium alloy matrix
composite [RZ5/10 wt.% TiB 2 ] was measured using an optical profilometer and is
shown in Fig. 7. The surface roughness of the composite was measured taking an
average roughness (R a ) and root mean square of roughness (R q ) into consideration.
The surface generated by the 3-D profilometer, as shown in Fig. 7a, b, indicates the
average surface roughness to be 0.534 µm for 10 N load and 1.26 µm for 30 N. The
two-dimensional morphology of the wear surface is shown in Fig. 7c, d and indicates the peak-to-valley height along both the X direction and Y direction. It can be
attributed to the fact that at the higher applied loading condition, the abrasive particles
penetrate into more depth. So, the two-dimensional (2-D) topographic surface makes
it evident that the surface roughness value increases with an increase in applied load.