

60
J. Karloopia et al.
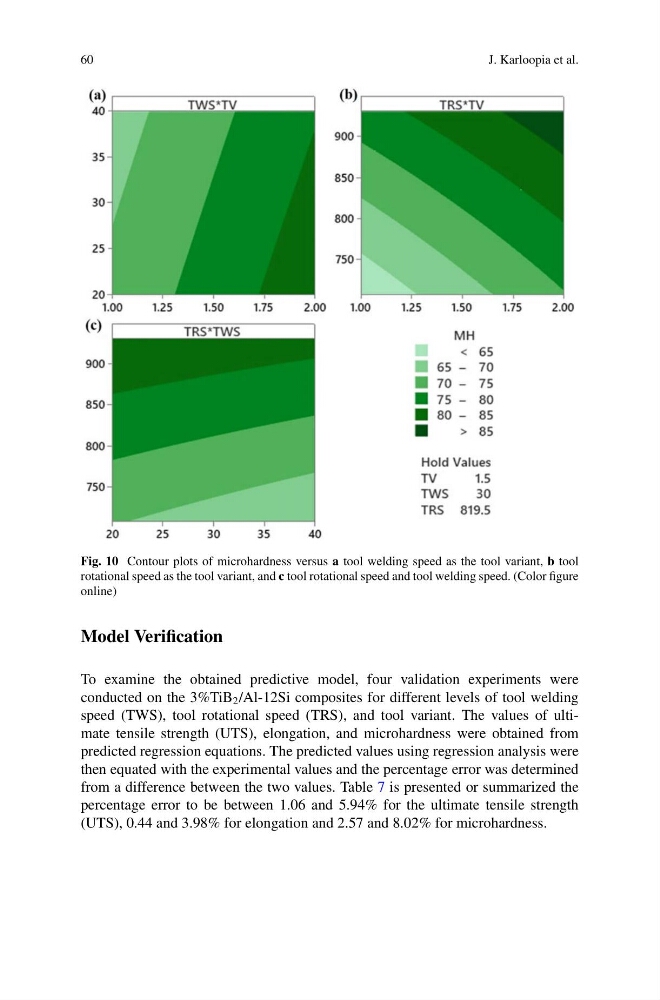
Fig. 10 Contour plots of microhardness versus a tool welding speed as the tool variant, b tool
rotational speed as the tool variant, and c tool rotational speed and tool welding speed. (Color figure
online)
Model Verification
To examine the obtained predictive model, four validation experiments were
conducted on the 3%TiB 2 /Al-12Si composites for different levels of tool welding
speed (TWS), tool rotational speed (TRS), and tool variant. The values of ultimate tensile strength (UTS), elongation, and microhardness were obtained from
predicted regression equations. The predicted values using regression analysis were
then equated with the experimental values and the percentage error was determined
from a difference between the two values. Table 7 is presented or summarized the
percentage error to be between 1.06 and 5.94% for the ultimate tensile strength
(UTS), 0.44 and 3.98% for elongation and 2.57 and 8.02% for microhardness.
J. Karloopia et al.
Fig. 10 Contour plots of microhardness versus a tool welding speed as the tool variant, b tool
rotational speed as the tool variant, and c tool rotational speed and tool welding speed. (Color figure
online)
Model Verification
To examine the obtained predictive model, four validation experiments were
conducted on the 3%TiB 2 /Al-12Si composites for different levels of tool welding
speed (TWS), tool rotational speed (TRS), and tool variant. The values of ultimate tensile strength (UTS), elongation, and microhardness were obtained from
predicted regression equations. The predicted values using regression analysis were
then equated with the experimental values and the percentage error was determined
from a difference between the two values. Table 7 is presented or summarized the
percentage error to be between 1.06 and 5.94% for the ultimate tensile strength
(UTS), 0.44 and 3.98% for elongation and 2.57 and 8.02% for microhardness.