

106
S. E. H. Murph and A. Goriounova
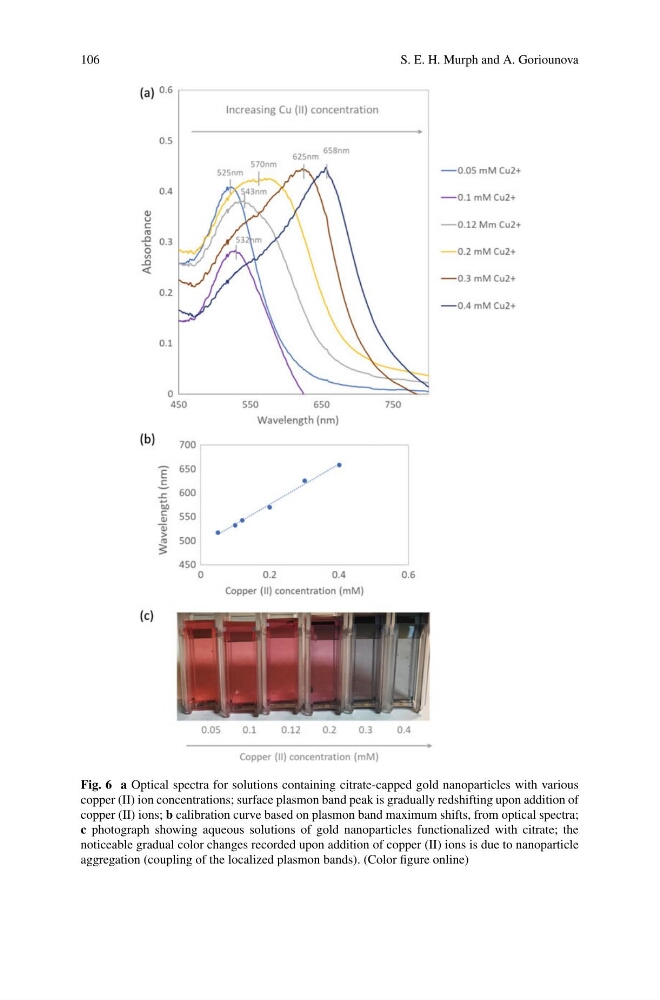
Fig. 6 a Optical spectra for solutions containing citrate-capped gold nanoparticles with various
copper (II) ion concentrations; surface plasmon band peak is gradually redshifting upon addition of
copper (II) ions; b calibration curve based on plasmon band maximum shifts, from optical spectra;
c photograph showing aqueous solutions of gold nanoparticles functionalized with citrate; the
noticeable gradual color changes recorded upon addition of copper (II) ions is due to nanoparticle
aggregation (coupling of the localized plasmon bands). (Color figure online)
S. E. H. Murph and A. Goriounova
Fig. 6 a Optical spectra for solutions containing citrate-capped gold nanoparticles with various
copper (II) ion concentrations; surface plasmon band peak is gradually redshifting upon addition of
copper (II) ions; b calibration curve based on plasmon band maximum shifts, from optical spectra;
c photograph showing aqueous solutions of gold nanoparticles functionalized with citrate; the
noticeable gradual color changes recorded upon addition of copper (II) ions is due to nanoparticle
aggregation (coupling of the localized plasmon bands). (Color figure online)