

In the development process of the RQ feedback control strategy on the Digital
Twin, various RQ value setpoints were tested, the controller parameters (gain,
integration time) of the PI controller were adjusted and the transfer intervals of the
calculated substrate feed rates to the DCU were varied. Furthermore, different ratios
of glucose and nitrogen sources in the feed medium were investigated. To achieve
the predetermined control target of 50 g L
À1 after a processing time of 48 h, four
simulations on the Digital Twin were performed.
The transfer of the RQ feedback control strategy to the real process took place
after simulations on the Digital Twin yielded a dry biomass concentration of more
than 50 g L
À1 within 48 h. Then, the RQ feedback control strategy was experimentally validated on the real cultivation process in the small scale STR. The results of
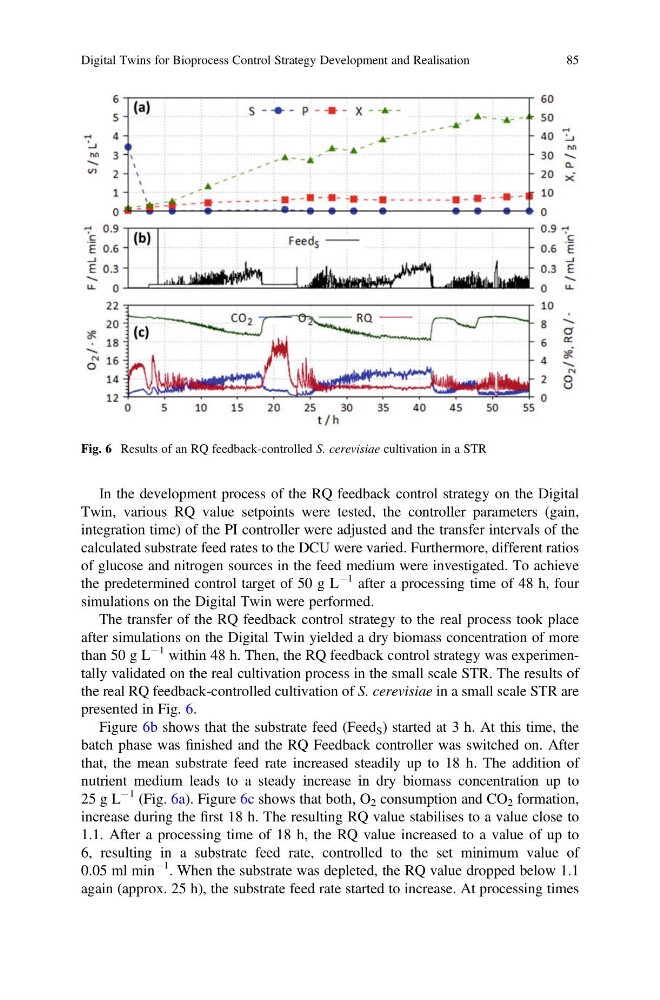
the real RQ feedback-controlled cultivation of S. cerevisiae in a small scale STR are
presented in Fig. 6.
Figure 6b shows that the substrate feed (Feed S ) started at 3 h. At this time, the
batch phase was finished and the RQ Feedback controller was switched on. After
that, the mean substrate feed rate increased steadily up to 18 h. The addition of
nutrient medium leads to a steady increase in dry biomass concentration up to
25 g L
À1 (Fig. 6a). Figure 6c shows that both, O 2 consumption and CO 2 formation,
increase during the first 18 h. The resulting RQ value stabilises to a value close to
1.1. After a processing time of 18 h, the RQ value increased to a value of up to
6, resulting in a substrate feed rate, controlled to the set minimum value of
0.05 ml min
À1 . When the substrate was depleted, the RQ value dropped below 1.1
again (approx. 25 h), the substrate feed rate started to increase. At processing times
Fig. 6 Results of an RQ feedback-controlled S. cerevisiae cultivation in a STR
Digital Twins for Bioprocess Control Strategy Development and Realisation
85
Twin, various RQ value setpoints were tested, the controller parameters (gain,
integration time) of the PI controller were adjusted and the transfer intervals of the
calculated substrate feed rates to the DCU were varied. Furthermore, different ratios
of glucose and nitrogen sources in the feed medium were investigated. To achieve
the predetermined control target of 50 g L
À1 after a processing time of 48 h, four
simulations on the Digital Twin were performed.
The transfer of the RQ feedback control strategy to the real process took place
after simulations on the Digital Twin yielded a dry biomass concentration of more
than 50 g L
À1 within 48 h. Then, the RQ feedback control strategy was experimentally validated on the real cultivation process in the small scale STR. The results of
the real RQ feedback-controlled cultivation of S. cerevisiae in a small scale STR are
presented in Fig. 6.
Figure 6b shows that the substrate feed (Feed S ) started at 3 h. At this time, the
batch phase was finished and the RQ Feedback controller was switched on. After
that, the mean substrate feed rate increased steadily up to 18 h. The addition of
nutrient medium leads to a steady increase in dry biomass concentration up to
25 g L
À1 (Fig. 6a). Figure 6c shows that both, O 2 consumption and CO 2 formation,
increase during the first 18 h. The resulting RQ value stabilises to a value close to
1.1. After a processing time of 18 h, the RQ value increased to a value of up to
6, resulting in a substrate feed rate, controlled to the set minimum value of
0.05 ml min
À1 . When the substrate was depleted, the RQ value dropped below 1.1
again (approx. 25 h), the substrate feed rate started to increase. At processing times
Fig. 6 Results of an RQ feedback-controlled S. cerevisiae cultivation in a STR
Digital Twins for Bioprocess Control Strategy Development and Realisation
85