

42
2 RFID System Physical Anti-Collision Experimental Verification
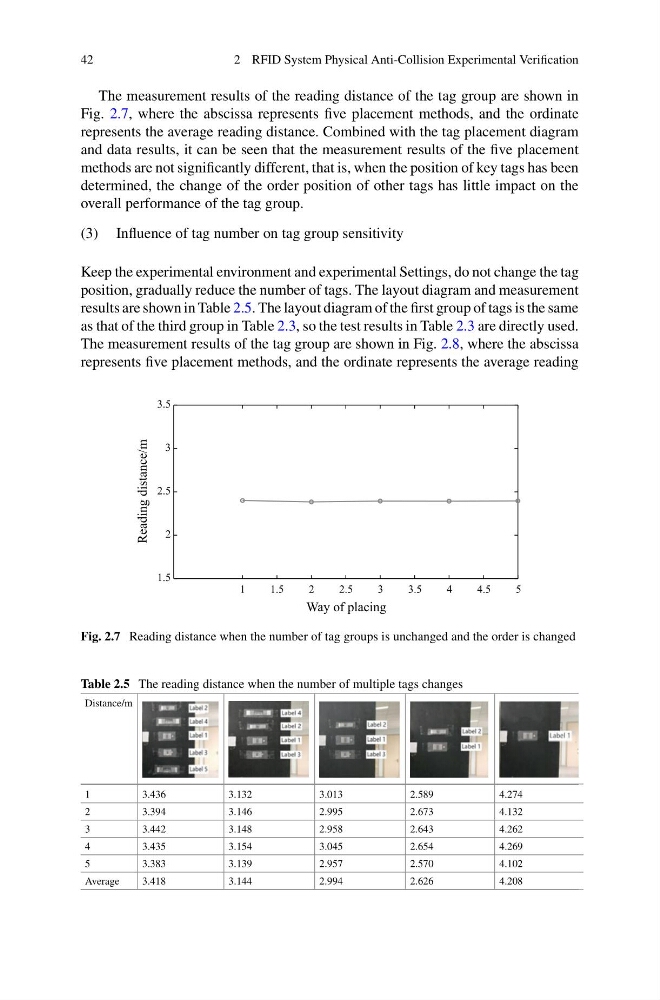
The measurement results of the reading distance of the tag group are shown in
Fig. 2.7, where the abscissa represents five placement methods, and the ordinate
represents the average reading distance. Combined with the tag placement diagram
and data results, it can be seen that the measurement results of the five placement
methods are not significantly different, that is, when the position of key tags has been
determined, the change of the order position of other tags has little impact on the
overall performance of the tag group.
(3) Influence of tag number on tag group sensitivity
Keep the experimental environment and experimental Settings, do not change the tag
position, gradually reduce the number of tags. The layout diagram and measurement
results are shown in Table 2.5. The layout diagram of the first group of tags is the same
as that of the third group in Table 2.3, so the test results in Table 2.3 are directly used.
The measurement results of the tag group are shown in Fig. 2.8, where the abscissa
represents five placement methods, and the ordinate represents the average reading
Fig. 2.7 Reading distance when the number of tag groups is unchanged and the order is changed
Table 2.5 The reading distance when the number of multiple tags changes
Distance/m
1
3.436
3.132
3.013
2.589
4.274
2
3.394
3.146
2.995
2.673
4.132
3
3.442
3.148
2.958
2.643
4.262
4
3.435
3.154
3.045
2.654
4.269
5
3.383
3.139
2.957
2.570
4.102
Average
3.418
3.144
2.994
2.626
4.208
2 RFID System Physical Anti-Collision Experimental Verification
The measurement results of the reading distance of the tag group are shown in
Fig. 2.7, where the abscissa represents five placement methods, and the ordinate
represents the average reading distance. Combined with the tag placement diagram
and data results, it can be seen that the measurement results of the five placement
methods are not significantly different, that is, when the position of key tags has been
determined, the change of the order position of other tags has little impact on the
overall performance of the tag group.
(3) Influence of tag number on tag group sensitivity
Keep the experimental environment and experimental Settings, do not change the tag
position, gradually reduce the number of tags. The layout diagram and measurement
results are shown in Table 2.5. The layout diagram of the first group of tags is the same
as that of the third group in Table 2.3, so the test results in Table 2.3 are directly used.
The measurement results of the tag group are shown in Fig. 2.8, where the abscissa
represents five placement methods, and the ordinate represents the average reading
Fig. 2.7 Reading distance when the number of tag groups is unchanged and the order is changed
Table 2.5 The reading distance when the number of multiple tags changes
Distance/m
1
3.436
3.132
3.013
2.589
4.274
2
3.394
3.146
2.995
2.673
4.132
3
3.442
3.148
2.958
2.643
4.262
4
3.435
3.154
3.045
2.654
4.269
5
3.383
3.139
2.957
2.570
4.102
Average
3.418
3.144
2.994
2.626
4.208