

2.1 RFID Tag Group Performance Measurement
39
5
4
3
2
1
0
Tag number
Sensitivity/dBm
−30
−20
−10
0
Calculated value
Measured value
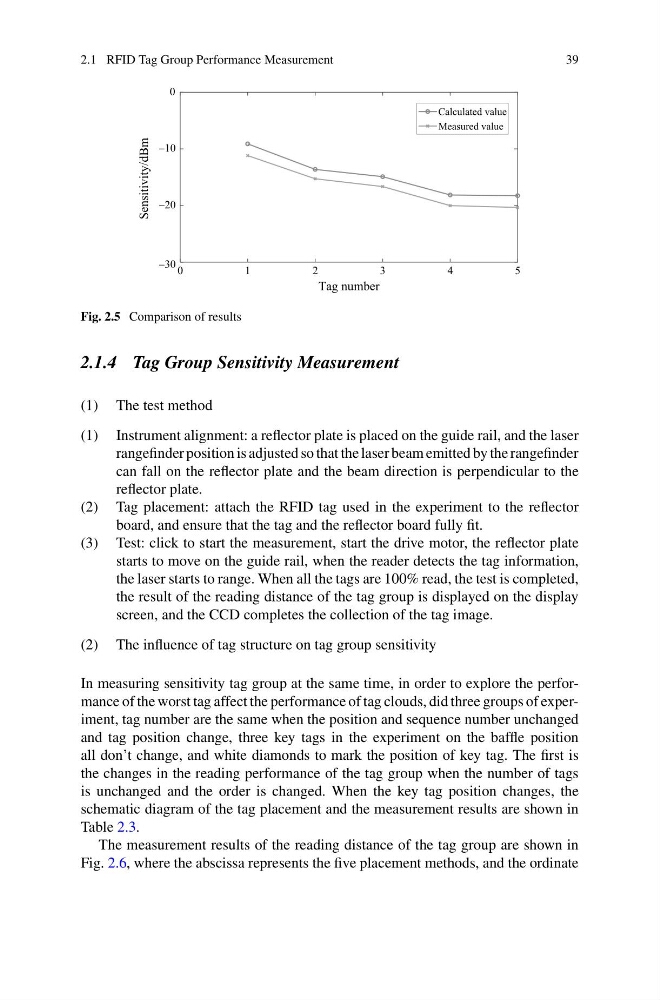
Fig. 2.5 Comparison of results
2.1.4 Tag Group Sensitivity Measurement
(1) The test method
(1) Instrument alignment: a reflector plate is placed on the guide rail, and the laser
rangefinder position is adjusted so that the laser beam emitted by the rangefinder
can fall on the reflector plate and the beam direction is perpendicular to the
reflector plate.
(2) Tag placement: attach the RFID tag used in the experiment to the reflector
board, and ensure that the tag and the reflector board fully fit.
(3) Test: click to start the measurement, start the drive motor, the reflector plate
starts to move on the guide rail, when the reader detects the tag information,
the laser starts to range. When all the tags are 100% read, the test is completed,
the result of the reading distance of the tag group is displayed on the display
screen, and the CCD completes the collection of the tag image.
(2) The influence of tag structure on tag group sensitivity
In measuring sensitivity tag group at the same time, in order to explore the performance of the worst tag affect the performance of tag clouds, did three groups of experiment, tag number are the same when the position and sequence number unchanged
and tag position change, three key tags in the experiment on the baffle position
all don’t change, and white diamonds to mark the position of key tag. The first is
the changes in the reading performance of the tag group when the number of tags
is unchanged and the order is changed. When the key tag position changes, the
schematic diagram of the tag placement and the measurement results are shown in
Table 2.3.
The measurement results of the reading distance of the tag group are shown in
Fig. 2.6, where the abscissa represents the five placement methods, and the ordinate
39
5
4
3
2
1
0
Tag number
Sensitivity/dBm
−30
−20
−10
0
Calculated value
Measured value
Fig. 2.5 Comparison of results
2.1.4 Tag Group Sensitivity Measurement
(1) The test method
(1) Instrument alignment: a reflector plate is placed on the guide rail, and the laser
rangefinder position is adjusted so that the laser beam emitted by the rangefinder
can fall on the reflector plate and the beam direction is perpendicular to the
reflector plate.
(2) Tag placement: attach the RFID tag used in the experiment to the reflector
board, and ensure that the tag and the reflector board fully fit.
(3) Test: click to start the measurement, start the drive motor, the reflector plate
starts to move on the guide rail, when the reader detects the tag information,
the laser starts to range. When all the tags are 100% read, the test is completed,
the result of the reading distance of the tag group is displayed on the display
screen, and the CCD completes the collection of the tag image.
(2) The influence of tag structure on tag group sensitivity
In measuring sensitivity tag group at the same time, in order to explore the performance of the worst tag affect the performance of tag clouds, did three groups of experiment, tag number are the same when the position and sequence number unchanged
and tag position change, three key tags in the experiment on the baffle position
all don’t change, and white diamonds to mark the position of key tag. The first is
the changes in the reading performance of the tag group when the number of tags
is unchanged and the order is changed. When the key tag position changes, the
schematic diagram of the tag placement and the measurement results are shown in
Table 2.3.
The measurement results of the reading distance of the tag group are shown in
Fig. 2.6, where the abscissa represents the five placement methods, and the ordinate