

2.1 RFID Tag Group Performance Measurement
37
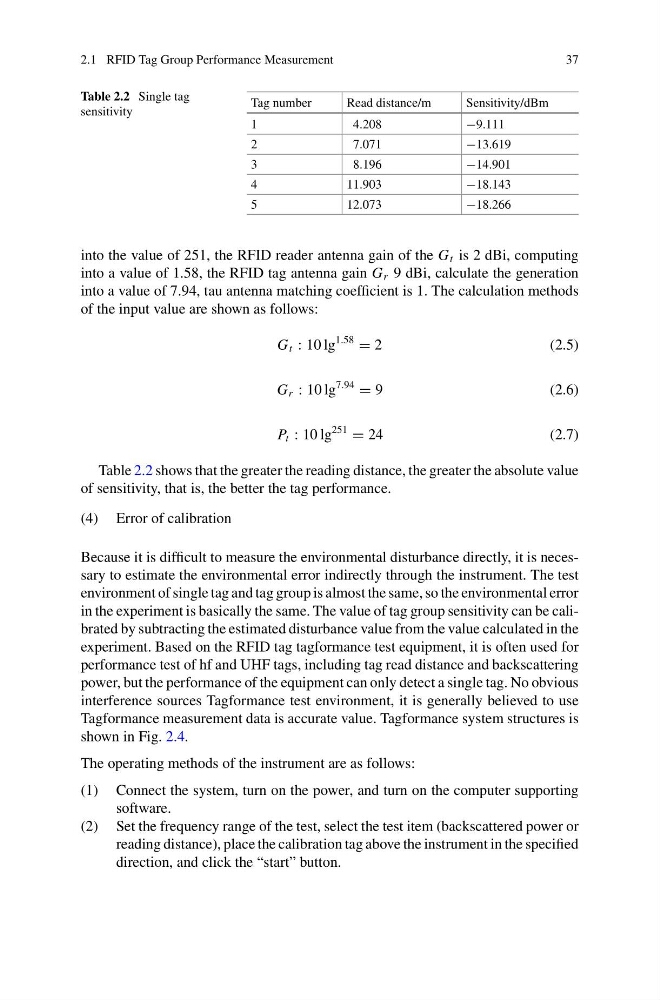
Table 2.2 Single tag
sensitivity
Tag number
Read distance/m
Sensitivity/dBm
1
4.208
−9.111
2
7.071
−13.619
3
8.196
−14.901
4
11.903
−18.143
5
12.073
−18.266
into the value of 251, the RFID reader antenna gain of the G t is 2 dBi, computing
into a value of 1.58, the RFID tag antenna gain G r 9 dBi, calculate the generation
into a value of 7.94, tau antenna matching coefficient is 1. The calculation methods
of the input value are shown as follows:
G t : 10 lg
1.58
= 2
(2.5)
G r : 10 lg
7.94
= 9
(2.6)
P t : 10 lg
251
= 24
(2.7)
Table 2.2 shows that the greater the reading distance, the greater the absolute value
of sensitivity, that is, the better the tag performance.
(4) Error of calibration
Because it is difficult to measure the environmental disturbance directly, it is necessary to estimate the environmental error indirectly through the instrument. The test
environment of single tag and tag group is almost the same, so the environmental error
in the experiment is basically the same. The value of tag group sensitivity can be calibrated by subtracting the estimated disturbance value from the value calculated in the
experiment. Based on the RFID tag tagformance test equipment, it is often used for
performance test of hf and UHF tags, including tag read distance and backscattering
power, but the performance of the equipment can only detect a single tag. No obvious
interference sources Tagformance test environment, it is generally believed to use
Tagformance measurement data is accurate value. Tagformance system structures is
shown in Fig. 2.4.
The operating methods of the instrument are as follows:
(1) Connect the system, turn on the power, and turn on the computer supporting
software.
(2) Set the frequency range of the test, select the test item (backscattered power or
reading distance), place the calibration tag above the instrument in the specified
direction, and click the “start” button.
37
Table 2.2 Single tag
sensitivity
Tag number
Read distance/m
Sensitivity/dBm
1
4.208
−9.111
2
7.071
−13.619
3
8.196
−14.901
4
11.903
−18.143
5
12.073
−18.266
into the value of 251, the RFID reader antenna gain of the G t is 2 dBi, computing
into a value of 1.58, the RFID tag antenna gain G r 9 dBi, calculate the generation
into a value of 7.94, tau antenna matching coefficient is 1. The calculation methods
of the input value are shown as follows:
G t : 10 lg
1.58
= 2
(2.5)
G r : 10 lg
7.94
= 9
(2.6)
P t : 10 lg
251
= 24
(2.7)
Table 2.2 shows that the greater the reading distance, the greater the absolute value
of sensitivity, that is, the better the tag performance.
(4) Error of calibration
Because it is difficult to measure the environmental disturbance directly, it is necessary to estimate the environmental error indirectly through the instrument. The test
environment of single tag and tag group is almost the same, so the environmental error
in the experiment is basically the same. The value of tag group sensitivity can be calibrated by subtracting the estimated disturbance value from the value calculated in the
experiment. Based on the RFID tag tagformance test equipment, it is often used for
performance test of hf and UHF tags, including tag read distance and backscattering
power, but the performance of the equipment can only detect a single tag. No obvious
interference sources Tagformance test environment, it is generally believed to use
Tagformance measurement data is accurate value. Tagformance system structures is
shown in Fig. 2.4.
The operating methods of the instrument are as follows:
(1) Connect the system, turn on the power, and turn on the computer supporting
software.
(2) Set the frequency range of the test, select the test item (backscattered power or
reading distance), place the calibration tag above the instrument in the specified
direction, and click the “start” button.