

184
5 Optimization Algorithm and RFID System Physical Anti-Collision
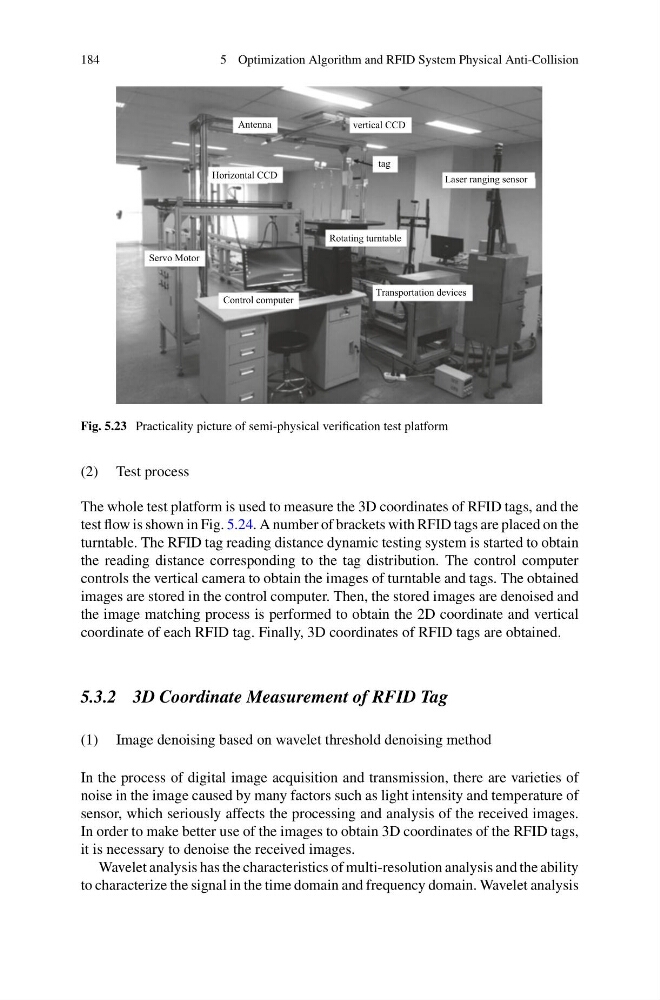
Fig. 5.23 Practicality picture of semi-physical verification test platform
(2) Test process
The whole test platform is used to measure the 3D coordinates of RFID tags, and the
test flow is shown in Fig. 5.24. A number of brackets with RFID tags are placed on the
turntable. The RFID tag reading distance dynamic testing system is started to obtain
the reading distance corresponding to the tag distribution. The control computer
controls the vertical camera to obtain the images of turntable and tags. The obtained
images are stored in the control computer. Then, the stored images are denoised and
the image matching process is performed to obtain the 2D coordinate and vertical
coordinate of each RFID tag. Finally, 3D coordinates of RFID tags are obtained.
5.3.2 3D Coordinate Measurement of RFID Tag
(1) Image denoising based on wavelet threshold denoising method
In the process of digital image acquisition and transmission, there are varieties of
noise in the image caused by many factors such as light intensity and temperature of
sensor, which seriously affects the processing and analysis of the received images.
In order to make better use of the images to obtain 3D coordinates of the RFID tags,
it is necessary to denoise the received images.
Wavelet analysis has the characteristics of multi-resolution analysis and the ability
to characterize the signal in the time domain and frequency domain. Wavelet analysis
5 Optimization Algorithm and RFID System Physical Anti-Collision
Fig. 5.23 Practicality picture of semi-physical verification test platform
(2) Test process
The whole test platform is used to measure the 3D coordinates of RFID tags, and the
test flow is shown in Fig. 5.24. A number of brackets with RFID tags are placed on the
turntable. The RFID tag reading distance dynamic testing system is started to obtain
the reading distance corresponding to the tag distribution. The control computer
controls the vertical camera to obtain the images of turntable and tags. The obtained
images are stored in the control computer. Then, the stored images are denoised and
the image matching process is performed to obtain the 2D coordinate and vertical
coordinate of each RFID tag. Finally, 3D coordinates of RFID tags are obtained.
5.3.2 3D Coordinate Measurement of RFID Tag
(1) Image denoising based on wavelet threshold denoising method
In the process of digital image acquisition and transmission, there are varieties of
noise in the image caused by many factors such as light intensity and temperature of
sensor, which seriously affects the processing and analysis of the received images.
In order to make better use of the images to obtain 3D coordinates of the RFID tags,
it is necessary to denoise the received images.
Wavelet analysis has the characteristics of multi-resolution analysis and the ability
to characterize the signal in the time domain and frequency domain. Wavelet analysis