

2.10 Nucleation During Electrochemical Phase Formation
41
(a)
(b)
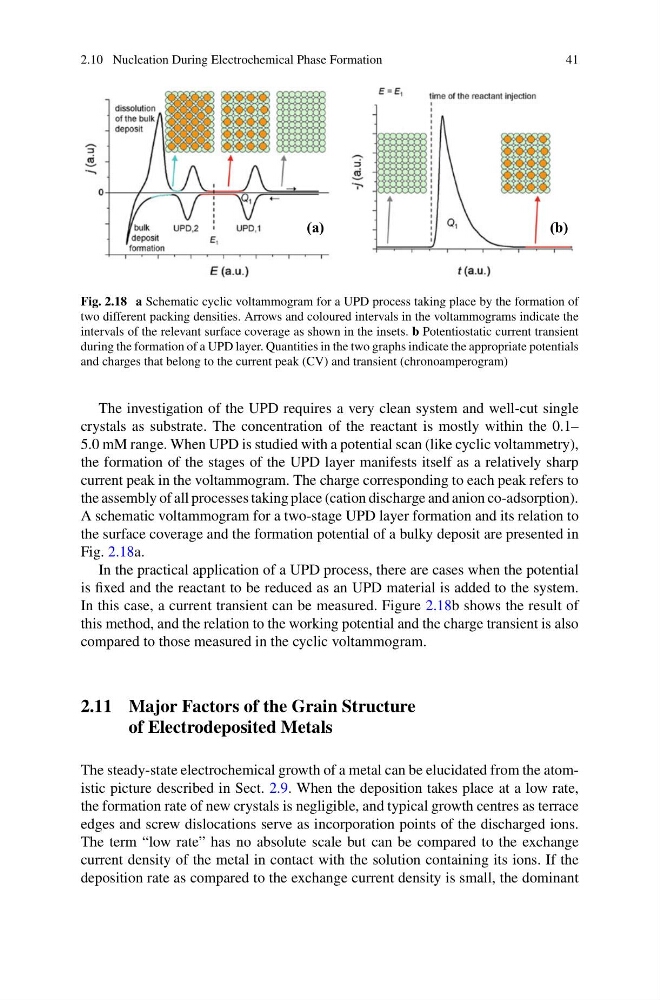
Fig. 2.18 a Schematic cyclic voltammogram for a UPD process taking place by the formation of
two different packing densities. Arrows and coloured intervals in the voltammograms indicate the
intervals of the relevant surface coverage as shown in the insets. b Potentiostatic current transient
during the formation of a UPD layer. Quantities in the two graphs indicate the appropriate potentials
and charges that belong to the current peak (CV) and transient (chronoamperogram)
The investigation of the UPD requires a very clean system and well-cut single
crystals as substrate. The concentration of the reactant is mostly within the 0.1–
5.0 mM range. When UPD is studied with a potential scan (like cyclic voltammetry),
the formation of the stages of the UPD layer manifests itself as a relatively sharp
current peak in the voltammogram. The charge corresponding to each peak refers to
the assembly of all processes taking place (cation discharge and anion co-adsorption).
A schematic voltammogram for a two-stage UPD layer formation and its relation to
the surface coverage and the formation potential of a bulky deposit are presented in
Fig. 2.18a.
In the practical application of a UPD process, there are cases when the potential
is fixed and the reactant to be reduced as an UPD material is added to the system.
In this case, a current transient can be measured. Figure 2.18b shows the result of
this method, and the relation to the working potential and the charge transient is also
compared to those measured in the cyclic voltammogram.
2.11 Major Factors of the Grain Structure
of Electrodeposited Metals
The steady-state electrochemical growth of a metal can be elucidated from the atomistic picture described in Sect. 2.9. When the deposition takes place at a low rate,
the formation rate of new crystals is negligible, and typical growth centres as terrace
edges and screw dislocations serve as incorporation points of the discharged ions.
The term “low rate” has no absolute scale but can be compared to the exchange
current density of the metal in contact with the solution containing its ions. If the
deposition rate as compared to the exchange current density is small, the dominant
41
(a)
(b)
Fig. 2.18 a Schematic cyclic voltammogram for a UPD process taking place by the formation of
two different packing densities. Arrows and coloured intervals in the voltammograms indicate the
intervals of the relevant surface coverage as shown in the insets. b Potentiostatic current transient
during the formation of a UPD layer. Quantities in the two graphs indicate the appropriate potentials
and charges that belong to the current peak (CV) and transient (chronoamperogram)
The investigation of the UPD requires a very clean system and well-cut single
crystals as substrate. The concentration of the reactant is mostly within the 0.1–
5.0 mM range. When UPD is studied with a potential scan (like cyclic voltammetry),
the formation of the stages of the UPD layer manifests itself as a relatively sharp
current peak in the voltammogram. The charge corresponding to each peak refers to
the assembly of all processes taking place (cation discharge and anion co-adsorption).
A schematic voltammogram for a two-stage UPD layer formation and its relation to
the surface coverage and the formation potential of a bulky deposit are presented in
Fig. 2.18a.
In the practical application of a UPD process, there are cases when the potential
is fixed and the reactant to be reduced as an UPD material is added to the system.
In this case, a current transient can be measured. Figure 2.18b shows the result of
this method, and the relation to the working potential and the charge transient is also
compared to those measured in the cyclic voltammogram.
2.11 Major Factors of the Grain Structure
of Electrodeposited Metals
The steady-state electrochemical growth of a metal can be elucidated from the atomistic picture described in Sect. 2.9. When the deposition takes place at a low rate,
the formation rate of new crystals is negligible, and typical growth centres as terrace
edges and screw dislocations serve as incorporation points of the discharged ions.
The term “low rate” has no absolute scale but can be compared to the exchange
current density of the metal in contact with the solution containing its ions. If the
deposition rate as compared to the exchange current density is small, the dominant