

13.7 Anodization of Valve Metals
497
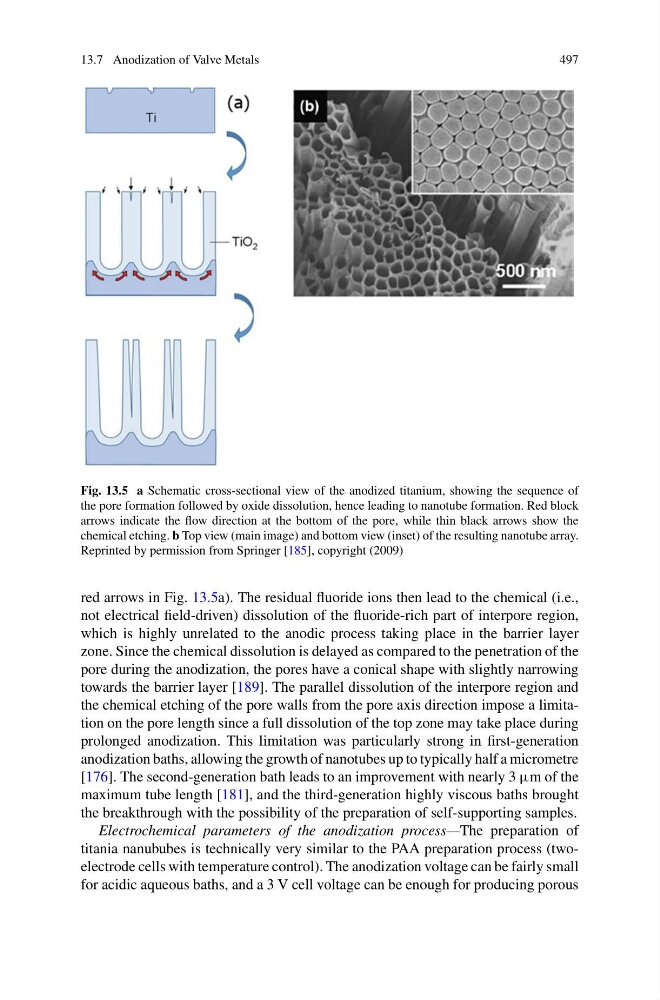
Fig. 13.5 a Schematic cross-sectional view of the anodized titanium, showing the sequence of
the pore formation followed by oxide dissolution, hence leading to nanotube formation. Red block
arrows indicate the flow direction at the bottom of the pore, while thin black arrows show the
chemical etching. b Top view (main image) and bottom view (inset) of the resulting nanotube array.
Reprinted by permission from Springer [185], copyright (2009)
red arrows in Fig. 13.5a). The residual fluoride ions then lead to the chemical (i.e.,
not electrical field-driven) dissolution of the fluoride-rich part of interpore region,
which is highly unrelated to the anodic process taking place in the barrier layer
zone. Since the chemical dissolution is delayed as compared to the penetration of the
pore during the anodization, the pores have a conical shape with slightly narrowing
towards the barrier layer [189]. The parallel dissolution of the interpore region and
the chemical etching of the pore walls from the pore axis direction impose a limitation on the pore length since a full dissolution of the top zone may take place during
prolonged anodization. This limitation was particularly strong in first-generation
anodization baths, allowing the growth of nanotubes up to typically half a micrometre
[176]. The second-generation bath leads to an improvement with nearly 3 μm of the
maximum tube length [181], and the third-generation highly viscous baths brought
the breakthrough with the possibility of the preparation of self-supporting samples.
Electrochemical parameters of the anodization process—The preparation of
titania nanububes is technically very similar to the PAA preparation process (twoelectrode cells with temperature control). The anodization voltage can be fairly small
for acidic aqueous baths, and a 3 V cell voltage can be enough for producing porous
497
Fig. 13.5 a Schematic cross-sectional view of the anodized titanium, showing the sequence of
the pore formation followed by oxide dissolution, hence leading to nanotube formation. Red block
arrows indicate the flow direction at the bottom of the pore, while thin black arrows show the
chemical etching. b Top view (main image) and bottom view (inset) of the resulting nanotube array.
Reprinted by permission from Springer [185], copyright (2009)
red arrows in Fig. 13.5a). The residual fluoride ions then lead to the chemical (i.e.,
not electrical field-driven) dissolution of the fluoride-rich part of interpore region,
which is highly unrelated to the anodic process taking place in the barrier layer
zone. Since the chemical dissolution is delayed as compared to the penetration of the
pore during the anodization, the pores have a conical shape with slightly narrowing
towards the barrier layer [189]. The parallel dissolution of the interpore region and
the chemical etching of the pore walls from the pore axis direction impose a limitation on the pore length since a full dissolution of the top zone may take place during
prolonged anodization. This limitation was particularly strong in first-generation
anodization baths, allowing the growth of nanotubes up to typically half a micrometre
[176]. The second-generation bath leads to an improvement with nearly 3 μm of the
maximum tube length [181], and the third-generation highly viscous baths brought
the breakthrough with the possibility of the preparation of self-supporting samples.
Electrochemical parameters of the anodization process—The preparation of
titania nanububes is technically very similar to the PAA preparation process (twoelectrode cells with temperature control). The anodization voltage can be fairly small
for acidic aqueous baths, and a 3 V cell voltage can be enough for producing porous