

12.4 Deposition with the Help of Tips
457
remain ineffective for the deposition onto the substrate, and the ions produced in the
round-shaped end of the tip can be re-deposited onto the substrate. Hence, the radius
of the metal dot plated onto the substrate is about twice of the tip curvature radius near
the end. Due to the small efficiency of the metal deposition at the substrate as referred
to the charge corresponding to the collection step at the tip, the latter parameter can be
used for the process regulation only by measuring an empirical recollection efficiency
for a particular tip at a fixed distance. Literature data are available for Co deposition
on Au substrate [123–125] and Pb deposition onto Ag(111) [126]. Tip current in the
subsequent intervals of a cycle and nanodots imaged in the same STM system that
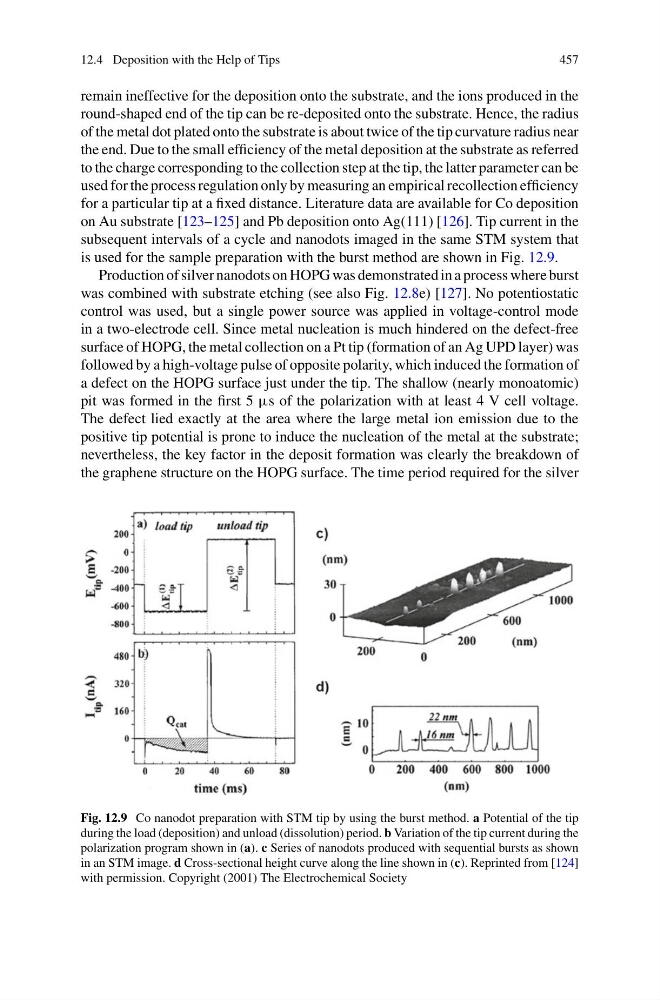
is used for the sample preparation with the burst method are shown in Fig. 12.9.
Production of silver nanodots on HOPG was demonstrated in a process where burst
was combined with substrate etching (see also Fig. 12.8e) [127]. No potentiostatic
control was used, but a single power source was applied in voltage-control mode
in a two-electrode cell. Since metal nucleation is much hindered on the defect-free
surface of HOPG, the metal collection on a Pt tip (formation of an Ag UPD layer) was
followed by a high-voltage pulse of opposite polarity, which induced the formation of
a defect on the HOPG surface just under the tip. The shallow (nearly monoatomic)
pit was formed in the first 5 µs of the polarization with at least 4 V cell voltage.
The defect lied exactly at the area where the large metal ion emission due to the
positive tip potential is prone to induce the nucleation of the metal at the substrate;
nevertheless, the key factor in the deposit formation was clearly the breakdown of
the graphene structure on the HOPG surface. The time period required for the silver
Fig. 12.9 Co nanodot preparation with STM tip by using the burst method. a Potential of the tip
during the load (deposition) and unload (dissolution) period. b Variation of the tip current during the
polarization program shown in (a). c Series of nanodots produced with sequential bursts as shown
in an STM image. d Cross-sectional height curve along the line shown in (c). Reprinted from [124]
with permission. Copyright (2001) The Electrochemical Society
457
remain ineffective for the deposition onto the substrate, and the ions produced in the
round-shaped end of the tip can be re-deposited onto the substrate. Hence, the radius
of the metal dot plated onto the substrate is about twice of the tip curvature radius near
the end. Due to the small efficiency of the metal deposition at the substrate as referred
to the charge corresponding to the collection step at the tip, the latter parameter can be
used for the process regulation only by measuring an empirical recollection efficiency
for a particular tip at a fixed distance. Literature data are available for Co deposition
on Au substrate [123–125] and Pb deposition onto Ag(111) [126]. Tip current in the
subsequent intervals of a cycle and nanodots imaged in the same STM system that
is used for the sample preparation with the burst method are shown in Fig. 12.9.
Production of silver nanodots on HOPG was demonstrated in a process where burst
was combined with substrate etching (see also Fig. 12.8e) [127]. No potentiostatic
control was used, but a single power source was applied in voltage-control mode
in a two-electrode cell. Since metal nucleation is much hindered on the defect-free
surface of HOPG, the metal collection on a Pt tip (formation of an Ag UPD layer) was
followed by a high-voltage pulse of opposite polarity, which induced the formation of
a defect on the HOPG surface just under the tip. The shallow (nearly monoatomic)
pit was formed in the first 5 µs of the polarization with at least 4 V cell voltage.
The defect lied exactly at the area where the large metal ion emission due to the
positive tip potential is prone to induce the nucleation of the metal at the substrate;
nevertheless, the key factor in the deposit formation was clearly the breakdown of
the graphene structure on the HOPG surface. The time period required for the silver
Fig. 12.9 Co nanodot preparation with STM tip by using the burst method. a Potential of the tip
during the load (deposition) and unload (dissolution) period. b Variation of the tip current during the
polarization program shown in (a). c Series of nanodots produced with sequential bursts as shown
in an STM image. d Cross-sectional height curve along the line shown in (c). Reprinted from [124]
with permission. Copyright (2001) The Electrochemical Society