

12.3 Deposition at the Liquid–Liquid Interface
451
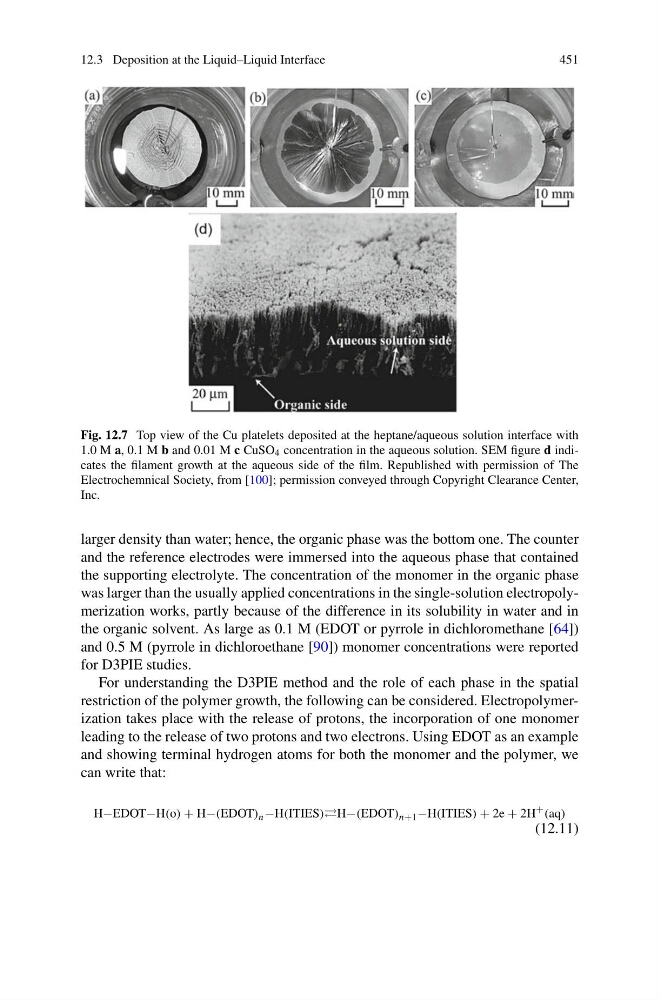
Fig. 12.7 Top view of the Cu platelets deposited at the heptane/aqueous solution interface with
1.0 M a, 0.1 M b and 0.01 M c CuSO 4 concentration in the aqueous solution. SEM figure d indicates the filament growth at the aqueous side of the film. Republished with permission of The
Electrochemnical Society, from [100]; permission conveyed through Copyright Clearance Center,
Inc.
larger density than water; hence, the organic phase was the bottom one. The counter
and the reference electrodes were immersed into the aqueous phase that contained
the supporting electrolyte. The concentration of the monomer in the organic phase
was larger than the usually applied concentrations in the single-solution electropolymerization works, partly because of the difference in its solubility in water and in
the organic solvent. As large as 0.1 M (EDOT or pyrrole in dichloromethane [64])
and 0.5 M (pyrrole in dichloroethane [90]) monomer concentrations were reported
for D3PIE studies.
For understanding the D3PIE method and the role of each phase in the spatial
restriction of the polymer growth, the following can be considered. Electropolymerization takes place with the release of protons, the incorporation of one monomer
leading to the release of two protons and two electrons. Using EDOT as an example
and showing terminal hydrogen atoms for both the monomer and the polymer, we
can write that:
H−EDOT−H(o) + H−(EDOT) n −H(ITIES)H−(EDOT) n+1 −H(ITIES) + 2e + 2H
+ (aq)
(12.11)
451
Fig. 12.7 Top view of the Cu platelets deposited at the heptane/aqueous solution interface with
1.0 M a, 0.1 M b and 0.01 M c CuSO 4 concentration in the aqueous solution. SEM figure d indicates the filament growth at the aqueous side of the film. Republished with permission of The
Electrochemnical Society, from [100]; permission conveyed through Copyright Clearance Center,
Inc.
larger density than water; hence, the organic phase was the bottom one. The counter
and the reference electrodes were immersed into the aqueous phase that contained
the supporting electrolyte. The concentration of the monomer in the organic phase
was larger than the usually applied concentrations in the single-solution electropolymerization works, partly because of the difference in its solubility in water and in
the organic solvent. As large as 0.1 M (EDOT or pyrrole in dichloromethane [64])
and 0.5 M (pyrrole in dichloroethane [90]) monomer concentrations were reported
for D3PIE studies.
For understanding the D3PIE method and the role of each phase in the spatial
restriction of the polymer growth, the following can be considered. Electropolymerization takes place with the release of protons, the incorporation of one monomer
leading to the release of two protons and two electrons. Using EDOT as an example
and showing terminal hydrogen atoms for both the monomer and the polymer, we
can write that:
H−EDOT−H(o) + H−(EDOT) n −H(ITIES)H−(EDOT) n+1 −H(ITIES) + 2e + 2H
+ (aq)
(12.11)