

10.3 Electrodeposition on Surfaces with Step Edges
331
a
b
c
d
e
f
Fig. 10.5 Scanning electron microscopic images of ESED-plated nanowires of different composition: a—Cu [21], b—Cd [23], c—Ag [24], d—Pd–Ni [25], e—Cu 2 O [26], f—MoO 2 [27]. For
deposition conditions, refer to the original works. Reprinted with permission from the works identified next to the figures. Copyright, in the order of appearance, (2002), (2005), (2002), (2008),
(2013) and (2002). With permission from the American Chemical Society (a, b and f), Elsevier
(c and e) and Springer (d)
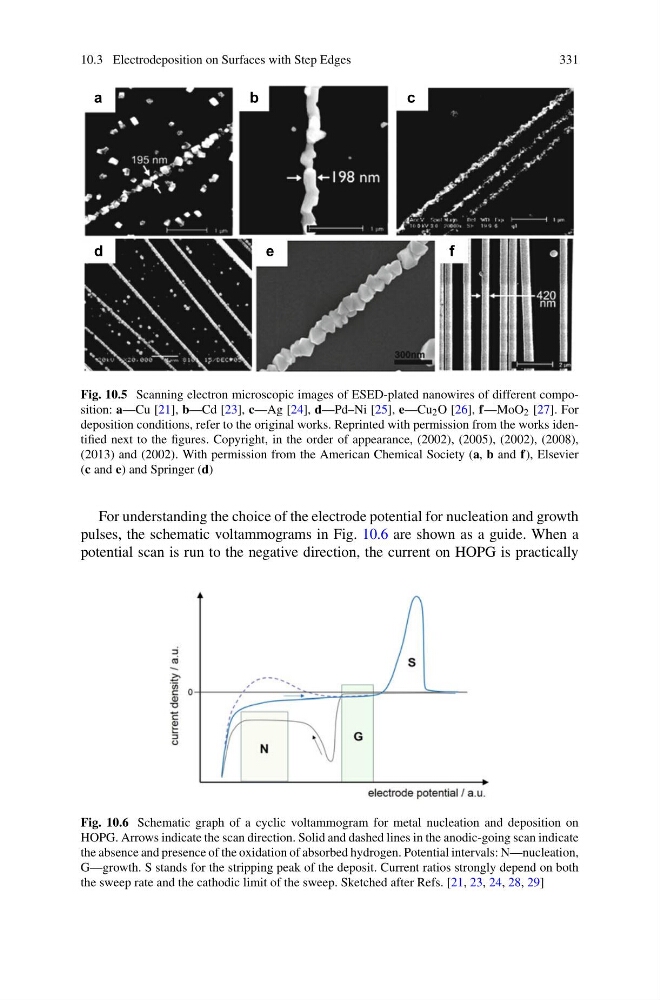
For understanding the choice of the electrode potential for nucleation and growth
pulses, the schematic voltammograms in Fig. 10.6 are shown as a guide. When a
potential scan is run to the negative direction, the current on HOPG is practically
Fig. 10.6 Schematic graph of a cyclic voltammogram for metal nucleation and deposition on
HOPG. Arrows indicate the scan direction. Solid and dashed lines in the anodic-going scan indicate
the absence and presence of the oxidation of absorbed hydrogen. Potential intervals: N—nucleation,
G—growth. S stands for the stripping peak of the deposit. Current ratios strongly depend on both
the sweep rate and the cathodic limit of the sweep. Sketched after Refs. [21, 23, 24, 28, 29]
331
a
b
c
d
e
f
Fig. 10.5 Scanning electron microscopic images of ESED-plated nanowires of different composition: a—Cu [21], b—Cd [23], c—Ag [24], d—Pd–Ni [25], e—Cu 2 O [26], f—MoO 2 [27]. For
deposition conditions, refer to the original works. Reprinted with permission from the works identified next to the figures. Copyright, in the order of appearance, (2002), (2005), (2002), (2008),
(2013) and (2002). With permission from the American Chemical Society (a, b and f), Elsevier
(c and e) and Springer (d)
For understanding the choice of the electrode potential for nucleation and growth
pulses, the schematic voltammograms in Fig. 10.6 are shown as a guide. When a
potential scan is run to the negative direction, the current on HOPG is practically
Fig. 10.6 Schematic graph of a cyclic voltammogram for metal nucleation and deposition on
HOPG. Arrows indicate the scan direction. Solid and dashed lines in the anodic-going scan indicate
the absence and presence of the oxidation of absorbed hydrogen. Potential intervals: N—nucleation,
G—growth. S stands for the stripping peak of the deposit. Current ratios strongly depend on both
the sweep rate and the cathodic limit of the sweep. Sketched after Refs. [21, 23, 24, 28, 29]