

260
8 Porous Nanostructured Materials
(a)
(c)
(b)
(d)
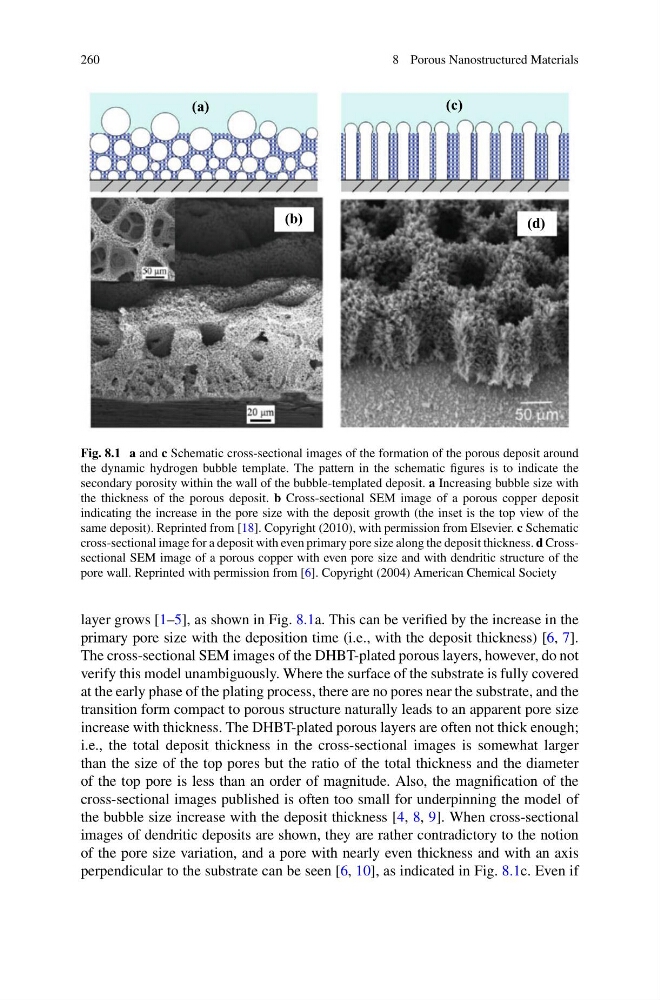
Fig. 8.1 a and c Schematic cross-sectional images of the formation of the porous deposit around
the dynamic hydrogen bubble template. The pattern in the schematic figures is to indicate the
secondary porosity within the wall of the bubble-templated deposit. a Increasing bubble size with
the thickness of the porous deposit. b Cross-sectional SEM image of a porous copper deposit
indicating the increase in the pore size with the deposit growth (the inset is the top view of the
same deposit). Reprinted from [18]. Copyright (2010), with permission from Elsevier. c Schematic
cross-sectional image for a deposit with even primary pore size along the deposit thickness. d Crosssectional SEM image of a porous copper with even pore size and with dendritic structure of the
pore wall. Reprinted with permission from [6]. Copyright (2004) American Chemical Society
layer grows [1–5], as shown in Fig. 8.1a. This can be verified by the increase in the
primary pore size with the deposition time (i.e., with the deposit thickness) [6, 7].
The cross-sectional SEM images of the DHBT-plated porous layers, however, do not
verify this model unambiguously. Where the surface of the substrate is fully covered
at the early phase of the plating process, there are no pores near the substrate, and the
transition form compact to porous structure naturally leads to an apparent pore size
increase with thickness. The DHBT-plated porous layers are often not thick enough;
i.e., the total deposit thickness in the cross-sectional images is somewhat larger
than the size of the top pores but the ratio of the total thickness and the diameter
of the top pore is less than an order of magnitude. Also, the magnification of the
cross-sectional images published is often too small for underpinning the model of
the bubble size increase with the deposit thickness [4, 8, 9]. When cross-sectional
images of dendritic deposits are shown, they are rather contradictory to the notion
of the pore size variation, and a pore with nearly even thickness and with an axis
perpendicular to the substrate can be seen [6, 10], as indicated in Fig. 8.1c. Even if
8 Porous Nanostructured Materials
(a)
(c)
(b)
(d)
Fig. 8.1 a and c Schematic cross-sectional images of the formation of the porous deposit around
the dynamic hydrogen bubble template. The pattern in the schematic figures is to indicate the
secondary porosity within the wall of the bubble-templated deposit. a Increasing bubble size with
the thickness of the porous deposit. b Cross-sectional SEM image of a porous copper deposit
indicating the increase in the pore size with the deposit growth (the inset is the top view of the
same deposit). Reprinted from [18]. Copyright (2010), with permission from Elsevier. c Schematic
cross-sectional image for a deposit with even primary pore size along the deposit thickness. d Crosssectional SEM image of a porous copper with even pore size and with dendritic structure of the
pore wall. Reprinted with permission from [6]. Copyright (2004) American Chemical Society
layer grows [1–5], as shown in Fig. 8.1a. This can be verified by the increase in the
primary pore size with the deposition time (i.e., with the deposit thickness) [6, 7].
The cross-sectional SEM images of the DHBT-plated porous layers, however, do not
verify this model unambiguously. Where the surface of the substrate is fully covered
at the early phase of the plating process, there are no pores near the substrate, and the
transition form compact to porous structure naturally leads to an apparent pore size
increase with thickness. The DHBT-plated porous layers are often not thick enough;
i.e., the total deposit thickness in the cross-sectional images is somewhat larger
than the size of the top pores but the ratio of the total thickness and the diameter
of the top pore is less than an order of magnitude. Also, the magnification of the
cross-sectional images published is often too small for underpinning the model of
the bubble size increase with the deposit thickness [4, 8, 9]. When cross-sectional
images of dendritic deposits are shown, they are rather contradictory to the notion
of the pore size variation, and a pore with nearly even thickness and with an axis
perpendicular to the substrate can be seen [6, 10], as indicated in Fig. 8.1c. Even if