

5.4 Properties of Electrodeposited CMAs
155
hence allowing a much larger transport rate than for a stagnant solution. If pulse
plating is applied, the transport rate of the metal ion is not enhanced; however, a
long enough time period is provided so that the same metal ion concentrations are
achieved by spontaneous diffusion as for the previous pulse, and this will lead to
identical conditions for each pulse.
The revelation of the occurrence of the spontaneous variation of the deposit
composition of d.c.-plated samples near the substrate has serious consequences on
the study of nanoscale layers. First, it is obvious that graded composition deposits are
obtained in most cases, which does not make it possible to relate any sample property
to the composition as a single variable. Secondly, the spontaneous variation in the
deposit composition bans the extrapolation of the composition of bulk deposits to
small layer thicknesses. For instance, it is very convenient to analyse the composition
of plated coatings of several micrometre thickness with EDS. However, one has to
be aware that the composition of a nanoscale alloy layer produced technically under
the same circumstances will not show the same composition as the thick deposit,
and, furthermore, the composition will not be even constant at the nanoscale if d.c.
plating is applied with uncontrolled hydrodynamics.
Although the zone with varying thickness shown in the above graphs ranges to a
few hundred nanometres, the fast depletion of the cathode diffusion zone with respect
to the preferentially deposited metal has a direct impact on nanoscale multilayers,
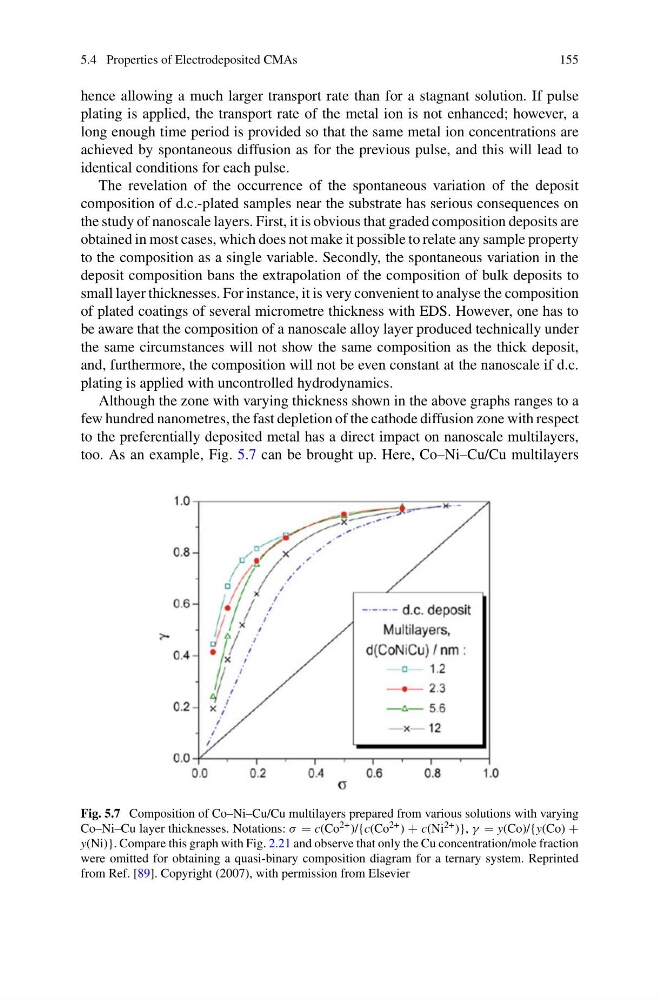
too. As an example, Fig. 5.7 can be brought up. Here, Co–Ni–Cu/Cu multilayers
Fig. 5.7 Composition of Co–Ni–Cu/Cu multilayers prepared from various solutions with varying
Co–Ni–Cu layer thicknesses. Notations: σ = c(Co 2+ )/{c(Co 2+ ) + c(Ni 2+ )}, γ = y(Co)/{y(Co) +
y(Ni)}. Compare this graph with Fig. 2.21 and observe that only the Cu concentration/mole fraction
were omitted for obtaining a quasi-binary composition diagram for a ternary system. Reprinted
from Ref. [89]. Copyright (2007), with permission from Elsevier
155
hence allowing a much larger transport rate than for a stagnant solution. If pulse
plating is applied, the transport rate of the metal ion is not enhanced; however, a
long enough time period is provided so that the same metal ion concentrations are
achieved by spontaneous diffusion as for the previous pulse, and this will lead to
identical conditions for each pulse.
The revelation of the occurrence of the spontaneous variation of the deposit
composition of d.c.-plated samples near the substrate has serious consequences on
the study of nanoscale layers. First, it is obvious that graded composition deposits are
obtained in most cases, which does not make it possible to relate any sample property
to the composition as a single variable. Secondly, the spontaneous variation in the
deposit composition bans the extrapolation of the composition of bulk deposits to
small layer thicknesses. For instance, it is very convenient to analyse the composition
of plated coatings of several micrometre thickness with EDS. However, one has to
be aware that the composition of a nanoscale alloy layer produced technically under
the same circumstances will not show the same composition as the thick deposit,
and, furthermore, the composition will not be even constant at the nanoscale if d.c.
plating is applied with uncontrolled hydrodynamics.
Although the zone with varying thickness shown in the above graphs ranges to a
few hundred nanometres, the fast depletion of the cathode diffusion zone with respect
to the preferentially deposited metal has a direct impact on nanoscale multilayers,
too. As an example, Fig. 5.7 can be brought up. Here, Co–Ni–Cu/Cu multilayers
Fig. 5.7 Composition of Co–Ni–Cu/Cu multilayers prepared from various solutions with varying
Co–Ni–Cu layer thicknesses. Notations: σ = c(Co 2+ )/{c(Co 2+ ) + c(Ni 2+ )}, γ = y(Co)/{y(Co) +
y(Ni)}. Compare this graph with Fig. 2.21 and observe that only the Cu concentration/mole fraction
were omitted for obtaining a quasi-binary composition diagram for a ternary system. Reprinted
from Ref. [89]. Copyright (2007), with permission from Elsevier