

142
5 Compositionally Modulated and Multilayered Deposits
for all codeposition modes included in the composition diagram in Fig. 2.21, but the
rule is also fulfilled for induced codeposition. For induced codeposition, the induced
metal can be classified as the preferentially deposited one in accord with the above
definition, at least in the current density range where continuous deposit layers can
be obtained.
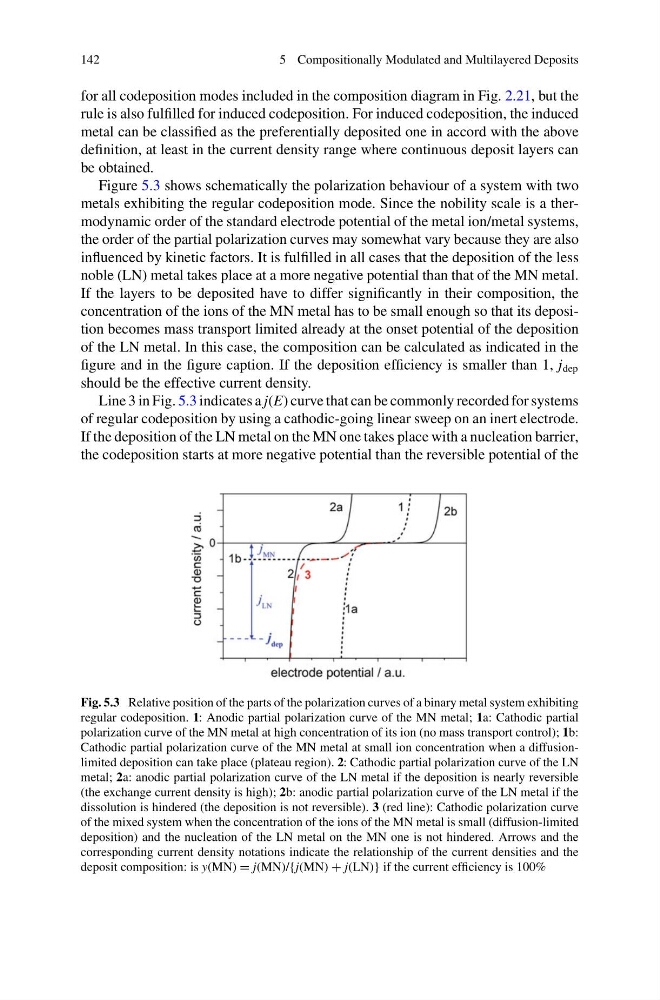
Figure 5.3 shows schematically the polarization behaviour of a system with two
metals exhibiting the regular codeposition mode. Since the nobility scale is a thermodynamic order of the standard electrode potential of the metal ion/metal systems,
the order of the partial polarization curves may somewhat vary because they are also
influenced by kinetic factors. It is fulfilled in all cases that the deposition of the less
noble (LN) metal takes place at a more negative potential than that of the MN metal.
If the layers to be deposited have to differ significantly in their composition, the
concentration of the ions of the MN metal has to be small enough so that its deposition becomes mass transport limited already at the onset potential of the deposition
of the LN metal. In this case, the composition can be calculated as indicated in the
figure and in the figure caption. If the deposition efficiency is smaller than 1, j dep
should be the effective current density.
Line 3 in Fig. 5.3 indicates a j(E) curve that can be commonly recorded for systems
of regular codeposition by using a cathodic-going linear sweep on an inert electrode.
If the deposition of the LN metal on the MN one takes place with a nucleation barrier,
the codeposition starts at more negative potential than the reversible potential of the
Fig. 5.3 Relative position of the parts of the polarization curves of a binary metal system exhibiting
regular codeposition. 1: Anodic partial polarization curve of the MN metal; 1a: Cathodic partial
polarization curve of the MN metal at high concentration of its ion (no mass transport control); 1b:
Cathodic partial polarization curve of the MN metal at small ion concentration when a diffusionlimited deposition can take place (plateau region). 2: Cathodic partial polarization curve of the LN
metal; 2a: anodic partial polarization curve of the LN metal if the deposition is nearly reversible
(the exchange current density is high); 2b: anodic partial polarization curve of the LN metal if the
dissolution is hindered (the deposition is not reversible). 3 (red line): Cathodic polarization curve
of the mixed system when the concentration of the ions of the MN metal is small (diffusion-limited
deposition) and the nucleation of the LN metal on the MN one is not hindered. Arrows and the
corresponding current density notations indicate the relationship of the current densities and the
deposit composition: is y(MN) = j(MN)/{j(MN) + j(LN)} if the current efficiency is 100%
5 Compositionally Modulated and Multilayered Deposits
for all codeposition modes included in the composition diagram in Fig. 2.21, but the
rule is also fulfilled for induced codeposition. For induced codeposition, the induced
metal can be classified as the preferentially deposited one in accord with the above
definition, at least in the current density range where continuous deposit layers can
be obtained.
Figure 5.3 shows schematically the polarization behaviour of a system with two
metals exhibiting the regular codeposition mode. Since the nobility scale is a thermodynamic order of the standard electrode potential of the metal ion/metal systems,
the order of the partial polarization curves may somewhat vary because they are also
influenced by kinetic factors. It is fulfilled in all cases that the deposition of the less
noble (LN) metal takes place at a more negative potential than that of the MN metal.
If the layers to be deposited have to differ significantly in their composition, the
concentration of the ions of the MN metal has to be small enough so that its deposition becomes mass transport limited already at the onset potential of the deposition
of the LN metal. In this case, the composition can be calculated as indicated in the
figure and in the figure caption. If the deposition efficiency is smaller than 1, j dep
should be the effective current density.
Line 3 in Fig. 5.3 indicates a j(E) curve that can be commonly recorded for systems
of regular codeposition by using a cathodic-going linear sweep on an inert electrode.
If the deposition of the LN metal on the MN one takes place with a nucleation barrier,
the codeposition starts at more negative potential than the reversible potential of the
Fig. 5.3 Relative position of the parts of the polarization curves of a binary metal system exhibiting
regular codeposition. 1: Anodic partial polarization curve of the MN metal; 1a: Cathodic partial
polarization curve of the MN metal at high concentration of its ion (no mass transport control); 1b:
Cathodic partial polarization curve of the MN metal at small ion concentration when a diffusionlimited deposition can take place (plateau region). 2: Cathodic partial polarization curve of the LN
metal; 2a: anodic partial polarization curve of the LN metal if the deposition is nearly reversible
(the exchange current density is high); 2b: anodic partial polarization curve of the LN metal if the
dissolution is hindered (the deposition is not reversible). 3 (red line): Cathodic polarization curve
of the mixed system when the concentration of the ions of the MN metal is small (diffusion-limited
deposition) and the nucleation of the LN metal on the MN one is not hindered. Arrows and the
corresponding current density notations indicate the relationship of the current densities and the
deposit composition: is y(MN) = j(MN)/{j(MN) + j(LN)} if the current efficiency is 100%