

Spectral Element Analysis of Non-stationary Wind …
469
(a)
(b)
(c)
0
10 20 30 40 50 60 70 80 90 100
Frequency [Hz]
10
-5
10
-4
10
-3
10
-2
10
-1
10
0
10
1
10
2
Receptance [dB ms
-2
/N]
FRF wind vibrations
0
2
4
6
8
1 0 12 14 16 18 20
Frequency [Hz]
10
-5
10
-4
10
-3
10
-2
10
-1
10
0
10
1
10
2
Receptance [dB ms
-2
/N]
FRF wind vibrations
1
2
3
4
5
6
7
8
9
10
Time [s]
-40
-30
-20
-10
0
10
20
30
Acceleration [m/s2]
Time history wind vibrations
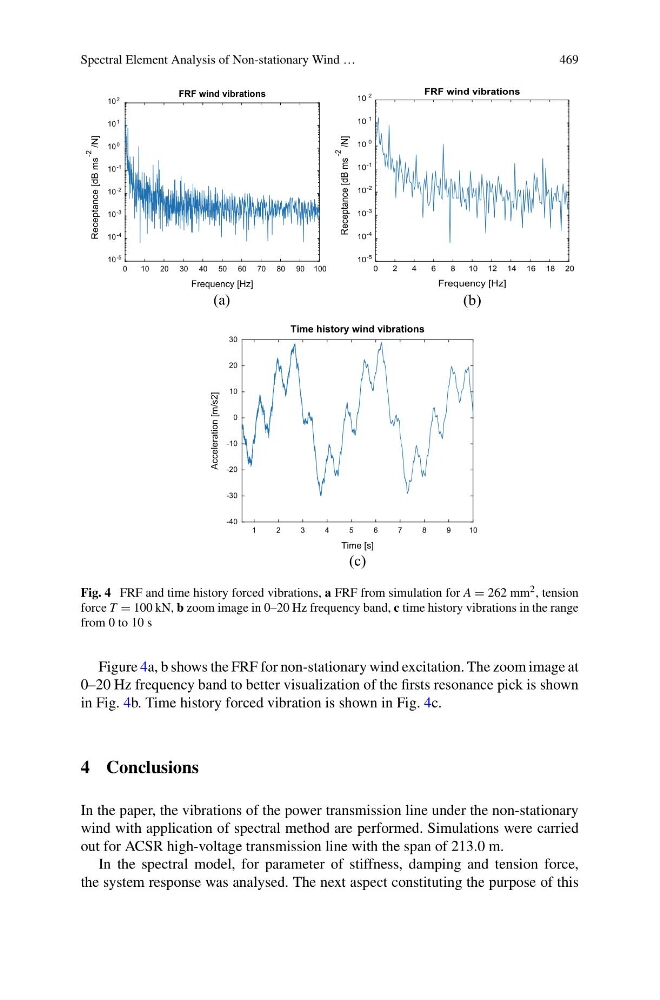
Fig. 4 FRF and time history forced vibrations, a FRF from simulation for A = 262 mm 2 , tension
force T = 100 kN, b zoom image in 0–20 Hz frequency band, c time history vibrations in the range
from 0 to 10 s
Figure 4a, b shows the FRF for non-stationary wind excitation. The zoom image at
0–20 Hz frequency band to better visualization of the firsts resonance pick is shown
in Fig. 4b. Time history forced vibration is shown in Fig. 4c.
4 Conclusions
In the paper, the vibrations of the power transmission line under the non-stationary
wind with application of spectral method are performed. Simulations were carried
out for ACSR high-voltage transmission line with the span of 213.0 m.
In the spectral model, for parameter of stiffness, damping and tension force,
the system response was analysed. The next aspect constituting the purpose of this
469
(a)
(b)
(c)
0
10 20 30 40 50 60 70 80 90 100
Frequency [Hz]
10
-5
10
-4
10
-3
10
-2
10
-1
10
0
10
1
10
2
Receptance [dB ms
-2
/N]
FRF wind vibrations
0
2
4
6
8
1 0 12 14 16 18 20
Frequency [Hz]
10
-5
10
-4
10
-3
10
-2
10
-1
10
0
10
1
10
2
Receptance [dB ms
-2
/N]
FRF wind vibrations
1
2
3
4
5
6
7
8
9
10
Time [s]
-40
-30
-20
-10
0
10
20
30
Acceleration [m/s2]
Time history wind vibrations
Fig. 4 FRF and time history forced vibrations, a FRF from simulation for A = 262 mm 2 , tension
force T = 100 kN, b zoom image in 0–20 Hz frequency band, c time history vibrations in the range
from 0 to 10 s
Figure 4a, b shows the FRF for non-stationary wind excitation. The zoom image at
0–20 Hz frequency band to better visualization of the firsts resonance pick is shown
in Fig. 4b. Time history forced vibration is shown in Fig. 4c.
4 Conclusions
In the paper, the vibrations of the power transmission line under the non-stationary
wind with application of spectral method are performed. Simulations were carried
out for ACSR high-voltage transmission line with the span of 213.0 m.
In the spectral model, for parameter of stiffness, damping and tension force,
the system response was analysed. The next aspect constituting the purpose of this