

410
R. Nagy et al.
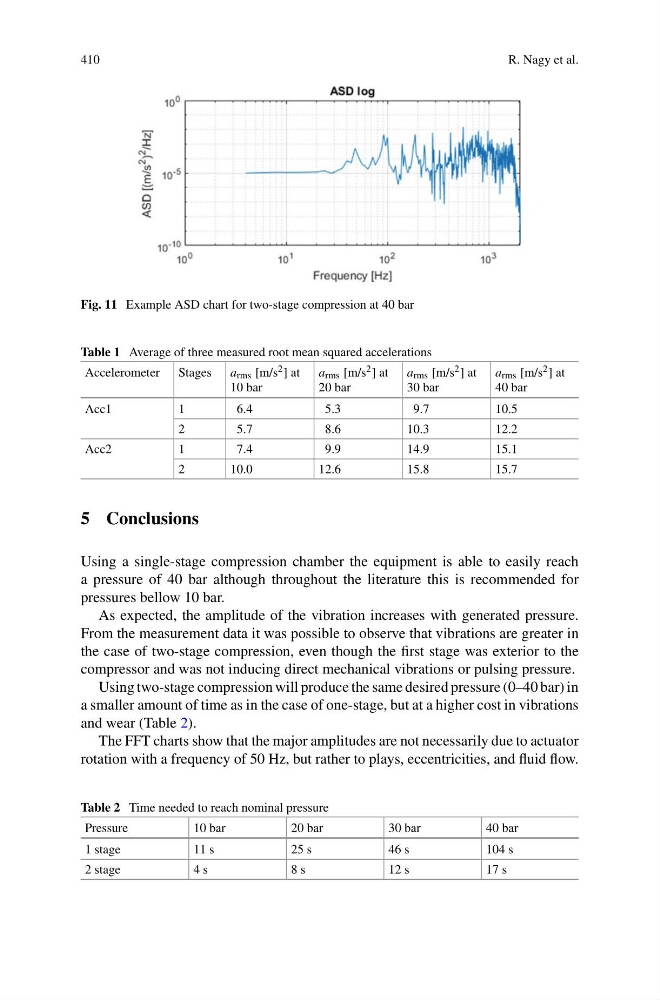
Fig. 11 Example ASD chart for two-stage compression at 40 bar
Table 1 Average of three measured root mean squared accelerations
Accelerometer Stages a rms [m/s 2 ] at
10 bar
a rms [m/s 2 ] at
20 bar
a rms [m/s 2 ] at
30 bar
a rms [m/s 2 ] at
40 bar
Acc1
1
6.4
5.3
9.7
10.5
2
5.7
8.6
10.3
12.2
Acc2
1
7.4
9.9
14.9
15.1
2
10.0
12.6
15.8
15.7
5 Conclusions
Using a single-stage compression chamber the equipment is able to easily reach
a pressure of 40 bar although throughout the literature this is recommended for
pressures bellow 10 bar.
As expected, the amplitude of the vibration increases with generated pressure.
From the measurement data it was possible to observe that vibrations are greater in
the case of two-stage compression, even though the first stage was exterior to the
compressor and was not inducing direct mechanical vibrations or pulsing pressure.
Using two-stage compression will produce the same desired pressure (0–40 bar) in
a smaller amount of time as in the case of one-stage, but at a higher cost in vibrations
and wear (Table 2).
The FFT charts show that the major amplitudes are not necessarily due to actuator
rotation with a frequency of 50 Hz, but rather to plays, eccentricities, and fluid flow.
Table 2 Time needed to reach nominal pressure
Pressure
10 bar
20 bar
30 bar
40 bar
1 stage
11 s
25 s
46 s
104 s
2 stage
4 s
8 s
12 s
17 s
R. Nagy et al.
Fig. 11 Example ASD chart for two-stage compression at 40 bar
Table 1 Average of three measured root mean squared accelerations
Accelerometer Stages a rms [m/s 2 ] at
10 bar
a rms [m/s 2 ] at
20 bar
a rms [m/s 2 ] at
30 bar
a rms [m/s 2 ] at
40 bar
Acc1
1
6.4
5.3
9.7
10.5
2
5.7
8.6
10.3
12.2
Acc2
1
7.4
9.9
14.9
15.1
2
10.0
12.6
15.8
15.7
5 Conclusions
Using a single-stage compression chamber the equipment is able to easily reach
a pressure of 40 bar although throughout the literature this is recommended for
pressures bellow 10 bar.
As expected, the amplitude of the vibration increases with generated pressure.
From the measurement data it was possible to observe that vibrations are greater in
the case of two-stage compression, even though the first stage was exterior to the
compressor and was not inducing direct mechanical vibrations or pulsing pressure.
Using two-stage compression will produce the same desired pressure (0–40 bar) in
a smaller amount of time as in the case of one-stage, but at a higher cost in vibrations
and wear (Table 2).
The FFT charts show that the major amplitudes are not necessarily due to actuator
rotation with a frequency of 50 Hz, but rather to plays, eccentricities, and fluid flow.
Table 2 Time needed to reach nominal pressure
Pressure
10 bar
20 bar
30 bar
40 bar
1 stage
11 s
25 s
46 s
104 s
2 stage
4 s
8 s
12 s
17 s