

312
D. Vl˘ adaia et al.
28
30
32
34
0
2 0
4 0
6 0
8 0
1 0 0
1 2 0
Temperature [°C]
Time [s]
Calve
Knee
Thigh
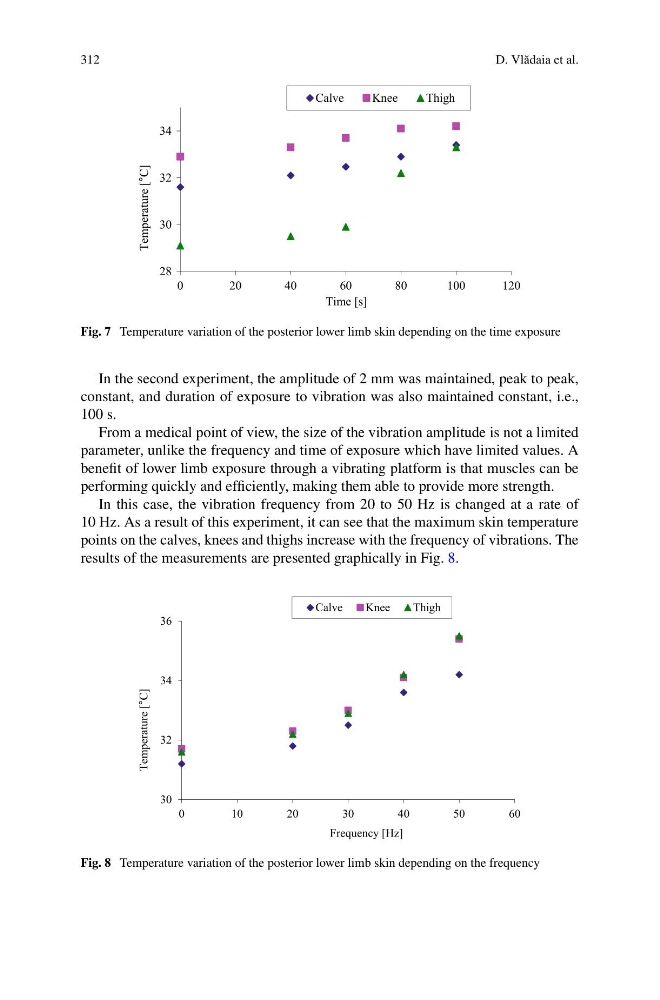
Fig. 7 Temperature variation of the posterior lower limb skin depending on the time exposure
In the second experiment, the amplitude of 2 mm was maintained, peak to peak,
constant, and duration of exposure to vibration was also maintained constant, i.e.,
100 s.
From a medical point of view, the size of the vibration amplitude is not a limited
parameter, unlike the frequency and time of exposure which have limited values. A
benefit of lower limb exposure through a vibrating platform is that muscles can be
performing quickly and efficiently, making them able to provide more strength.
In this case, the vibration frequency from 20 to 50 Hz is changed at a rate of
10 Hz. As a result of this experiment, it can see that the maximum skin temperature
points on the calves, knees and thighs increase with the frequency of vibrations. The
results of the measurements are presented graphically in Fig. 8.
30
32
34
36
0
1 0
2 0
3 0
4 0
5 0
6 0
Temperature [°C]
Frequency [Hz]
Calve
Knee
Thigh
Fig. 8 Temperature variation of the posterior lower limb skin depending on the frequency
D. Vl˘ adaia et al.
28
30
32
34
0
2 0
4 0
6 0
8 0
1 0 0
1 2 0
Temperature [°C]
Time [s]
Calve
Knee
Thigh
Fig. 7 Temperature variation of the posterior lower limb skin depending on the time exposure
In the second experiment, the amplitude of 2 mm was maintained, peak to peak,
constant, and duration of exposure to vibration was also maintained constant, i.e.,
100 s.
From a medical point of view, the size of the vibration amplitude is not a limited
parameter, unlike the frequency and time of exposure which have limited values. A
benefit of lower limb exposure through a vibrating platform is that muscles can be
performing quickly and efficiently, making them able to provide more strength.
In this case, the vibration frequency from 20 to 50 Hz is changed at a rate of
10 Hz. As a result of this experiment, it can see that the maximum skin temperature
points on the calves, knees and thighs increase with the frequency of vibrations. The
results of the measurements are presented graphically in Fig. 8.
30
32
34
36
0
1 0
2 0
3 0
4 0
5 0
6 0
Temperature [°C]
Frequency [Hz]
Calve
Knee
Thigh
Fig. 8 Temperature variation of the posterior lower limb skin depending on the frequency